 SUN-CENTERED PHYSICS
SUN-CENTERED PHYSICS
SUN-CENTERED PHYSICS
OUTREACH THEMES:
 Most of what goes on in the universe involves one form of
energy being transformed into another.
Everything in the universe is in constant motion;
changes in that motion are due to the effects of
forces.
All matter in the universe exerts gravitational forces.
Although energy is conserved, the total amount of
energy available for transformation is almost always
decreasing.
Energy is required for all technological processes.
Complicated motions are best described in terms of
patterns, such as waves and vibrations.
Electromagnetic radiation interacts with matter.
Fission and fusion involve far greater energy changes
than chemical reactions
Most of what goes on in the universe involves one form of
energy being transformed into another.
Everything in the universe is in constant motion;
changes in that motion are due to the effects of
forces.
All matter in the universe exerts gravitational forces.
Although energy is conserved, the total amount of
energy available for transformation is almost always
decreasing.
Energy is required for all technological processes.
Complicated motions are best described in terms of
patterns, such as waves and vibrations.
Electromagnetic radiation interacts with matter.
Fission and fusion involve far greater energy changes
than chemical reactions
The motion of the planets around the sun is typically used
in the study of circular motion. In the next lesson, the students
will be asked to determine the force of the sun on the earth, the
force of the earth on the sun and finally, the mass of the sun
from the information provided.
The movie "Independence Day" has once again raised the
issue of alien life. Recent reports have indicated that four
extrasolar systems have been discovered. The method used in all
cases involves the motion of the star with respect to the center
of mass of the system. A short compilation of three articles from
Astronomy acts as a motivator in the calculation of the center of
mass of the solar system. A further extension of the material
includes a calculation using the Drake Equation.
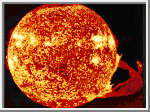
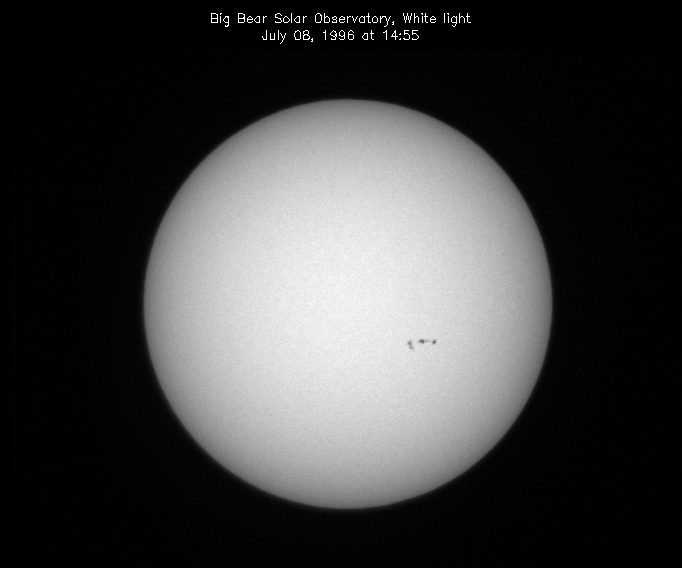
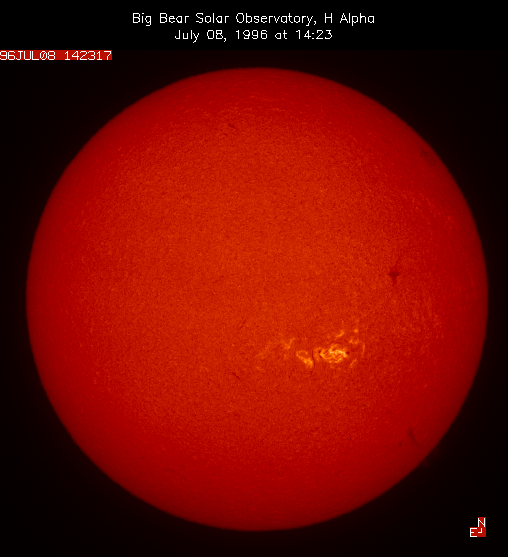
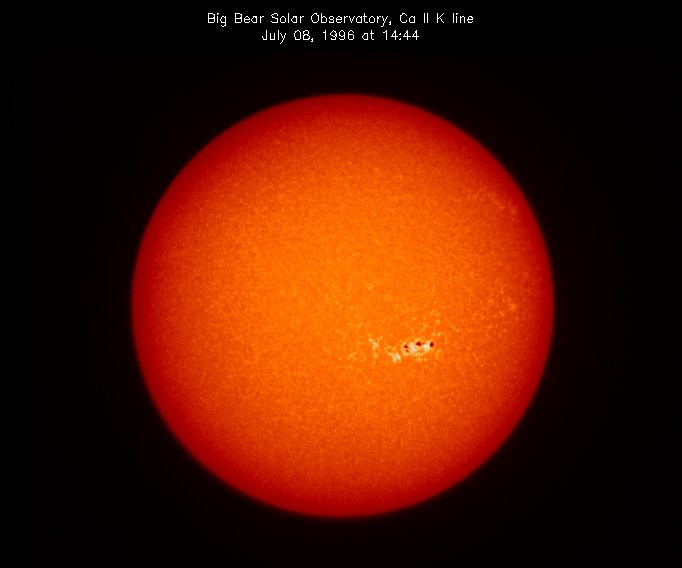
The energy released from the Sun encompasses the entire electromagnetic spectrum. What is visible with the naked eye is only a tiny fragment of the energy released. Many features of the Sun become visible when other wavelengths are used. Students will read an educational brief from NASA on the electromagnetic spectrum and then compare images of the Sun in white light, the H-alpha wavelength, the calcium II K line, extreme ultraviolet, and radiowaves.
Background:
Traditionally, students use a uniformly accelerated body
(such as a cart on an incline) whose displacement is marked with
a ticker or spark timer to calculate the average velocity and
acceleration of the body. Frequently students are asked to plot a
position vs time and a velocity vs time graph of this event. By
providing the student with a series of images of the Sun showing
a coronal mass ejection taken at known times and providing the
information needed to determine the position of the mass,
students can perform a similar manipulation of the data. The
difference being that they are given real data which might not
demonstrate uniform acceleration. This will help students realize
that uniform acceleration is a special case NOT the standard.
A coronal mass ejection occurs when a "significant amount of cool dense plasma or ionized gas escapes from the normally closed, confining, low-level magnetic fields of the Sun's atmosphere to streak out into the interplanetary medium, or heliosphere." (SOHO....The Unquiet Sun) In other words, a large quantity of mass is accelerated by the magnetic field of the corona and travels through space eventually reaching the Earth. "Eruptions of this sort can produce major disruptions in the near Earth environment, affecting communications, navigation systems and even power grids. SOHO, with its uninterrupted view of the Sun, can observe such events continually, and allow us for the first time to get a better understanding of how such violent events occur."
Explanation for the teacher:
Students will use a series of images of the Sun showing the
movement of the CME to calculate the average velocity and
acceleration. They will be given the problem and asked to come up
with their own solution. For students who have no clue, giving
them the diameter of the Sun could point them in the correct
direction. The following is an outline of one possible solution
to the problem. Using proportions, the students will determine
the position of a point of the mass for each frame and record the
values in a table. To find the position from the surface of the
Sun, students need to measure the diameter of the Sun and the
distance of the mass from the surface. Knowing the actual
diameter of the Sun, a proportion can be set up:
Discussion of results:
The average acceleration obtained by the student will depend
on how he/she decided to determine the position. It is clear from
the images that a plume of gas is moving faster than that of the
body. Should the student chose to follow the plume instead of the
center, the average velocities and accelerations will be greater.
REQUIREMENTS:
Materials
DATA TABLE:
| Universal Time | Time Interval | Position | Average Velocity | Average Acceleration |
|---|---|---|---|---|
| 08:05 | _ | _ | _ | _ |
| 08:36 | _ | _ | _ | _ |
| 09:27 | _ | _ | _ | _ |
| 10:25 | _ | _ | _ | _ |
| 11:23 | _ | _ | _ | _ |
Questions:
Objective:
Students will use astronomical data to calculate the
centripetal force of the Sun on the Earth.
Students will use the law of universal gravitation to calculate the mass of the Sun.
Background:
Traditionally, the movements of the planets around the Sun
and the moon around the Earth have been used in the study of
centripetal forces and the Law of Universal Gravitation. The
first step is to have the students calculate the centripetal
force exerted on the Earth by the Sun and the force of the Earth
on the Sun. Students will be given the mass of the Earth and its
average distance from the Sun. The next step is to have the
students determine the mass of the Sun from the period of
revolution around the Sun and the average distance of the Earth
from the Sun by equating the centripetal force with the gravitational force as shown below.
REQUIREMENTS:
Background:
As a result of the movie "Independence Day", one of the
hottest topics of conversation is the possibility of Earth being
visited by aliens. For years, scientists have been searching for
evidence that there are in fact other solar systems. Just
recently, four extra-solar planetary systems have been
discovered. This was done by looking for regular changes in the
Doppler shift of stars caused by the motion of the star around a
center of mass of the star-planet system (which is not at the
center of the star). The off-set of the center of mass is caused
by the presence of another body (the planet) moving around the
star. Thus far four stars or star-like objects outside out solar
system have been found to have planets orbiting them. The first
to be discovered consisted of three planets revolving around a
pulsar (which is a rapidly turning neutron star). The second is a
planet two times the mass of Jupiter in an orbit that is closer
to the Sun-like star than Mercury is to our Sun. The conditions
on these planets make them hostile to life as we know it. Two
other Jupiter-sized planets were found which are in a better
position to yield life. The first is orbiting the star 47 Ursea
(approximately 40 light-years away) which has a mass of about 3.5
Jupiters and an orbit somewhere between that of Mars and Jupiter.
The second is the planet around 70 Virginis (about 70 light-years
away) which is about 8 Jupiters in mass and 4/10 the distance of
the Earth from the Sun.
References:
Stephens, Sally: "Second Chance Planets", Astronomy, Jan 1996.
Naeye, Robert: "Is This Planet for Real?", Astronomy, Mar 1996.
Naeye, Robert: "Two New Solar Systems", Astronomy, Apr 1996.
Calculation of the center of mass of a system is generally a
part of the introductory physics class. Calculation of the center
of mass of the solar system and a discussion about how
astronomers are making use of this value in prospecting for
planets outside the solar system add a motivational factor to the
calculation.
Procedure:
To spike the student's interest, the reading "Planets Found
Outside the Solar System!" will be given to the students. It
is a summation of the three articles on extra-solar planets.
After students are familiar with the concept of center of mass, a list of the planet's masses and distances from the Sun will be displayed. The students will be asked to predict which of the planets will have the greatest impact on the position of the center of mass of the solar system. It is hoped that they will pick Jupiter as it is the most massive of the planets. Students will probably be surprised that the center of mass of the solar system lies within the surface of the Sun yet this causes the Sun's position to vary slightly with time.
Calculation of the probability of finding life is an
interesting open-ended question that will demonstrate to the
student that there are some problems for which there is no known
"right" answer. Their estimations are as good as the next as long
as they can support their answers with logical reasons.
| Name of Planet | Mass of Planet X 10 23 kg | Distance of Planet from Sun X 10 9 m |
|---|---|---|
| Sun | 19910000 | ------ |
| Mercury | 3.30 | 57.9 |
| Venus | 56.7 | 108.2 |
| Earth | 59.7 | 149.6 |
| Mars | 31.8 | 227.9 |
| Jupiter | 669 | 778.3 |
| Saturn | 562 | 1427 |
| Uranus | 245 | 2871 |
| Neptune | 233 | 4497 |
| Pluto | .199 | 5914 |
DRAKE EQUATION:
The first confirmed "sighting" of a planet outside the solar system occurred in the most unlikely place: around a pulsar. A pulsar is a very massive, very small, rapidly-spinning neutron star which forms as a result of the star running out of fuel and going supernova. A supernova explosion is very violent as the star's outer layer is ejected and sweeps out the region around the star leaving it free of debris. The core of the star collapses to the point where protons and electrons are squeezed together to make neutrons. The angular momentum of the star is conserved in the explosion so the new, much smaller star spins very rapidly. (Most pulsars rotate at a rate of less than one second per spin.) The rapidly-spinning star generates a large amount of energy which is ejected through the magnetic poles of the star. If the star is oriented so that the pole is pointed toward Earth during part of the spin, we see a pulse of energy much like a sailor sees the light house beam sweep past; thus the name pulsars.
Despite the unlikelihood of finding planets around pulsars, that is exactly what has happened. Four years ago, radio astronomer, Alex Wolszczan (pronounced VOL-shtan), found three and perhaps four small planets orbiting the millisecond pulsar PSR 1257+12 which he and a colleague had just discovered. Millisecond pulsars rotate hundreds of times per second and are more precise that atomic clocks. It is possible to predict arrival times of the radio pulsar to an accuracy of 3 milliseconds. PSR 1257+12 is a relatively old pulsar which should have a very regular pulse. Wolszczan noticed that the signal would sometimes arrive a few milliseconds early or a few milliseconds late. He also realized that there was a pattern to the variations that seemed somewhat periodic. After further analysis, he discovered two periods; one of 66.6 days and the other lasting 98.2 days which lead him to theorize that there are planets around the pulsar. The variation in the arrival times being caused by the planet's gravitational tug on the pulsar causing it to move ever-so-slightly toward and away from us. After publishing his results, many astronomers remained skeptical, theorizing a wobble in the axis of rotation or something strange happening inside the star. In 1994, after continuous monitoring, the perturbations caused by the gravitational interaction of the two planets was observed and the doubts were removed. These observations revealed the presence of a smaller, third planet and perhaps even a fourth one. The other half of the question is how the planets came to be orbiting a pulsar and many theories have been put forth to explain them. If you are interested in the explanation, refer to the article cited below by Sally Stephens.
The next extra solar planet was discovered by Michel Mayor near the Sun-like star, 51 Pegasi, located 55 to 60 light-years away. Based on the amplitude of the star's motion, the planet is one-half to two times the mass of Jupiter in an orbit that is 1/20 of the Earth's distance from the Sun. The orbital period of the planet around 51 Pegasi is 4.2 days. The temperature on the planet is estimated to be about 1000oC, much too hot for life as we know it.
Viewing the planets directly is not possible because the star is about a billion times brighter than the planet. The only way to "see" the planet is through the gravitational pull it exerts on the star. The rotation of the system about a common center of gravity, causes a repeating pattern in the position of the star which is detected in the spectrum. By repeatedly observing a star, this pattern becomes apparent. In the case of 51 Pegasi, the pattern repeats every 4.2 days like clockwork.
The next two planets were discovered by Geoff Marcy and Paul Butler who have been observing 120 solar-type stars since 1987. The team has been putting its effort into improving the detector and software rather than analyzing the data. After the announcement by Mayor, the team decided that their data might be good enough to detect large planets so they borrowed six powerful computers that they ran day and night analyzing 60 stars. Early in January 1996, the telltale patterns of two planets around two stars popped up. Both planets are more massive than Jupiter and are thought to be giant gaseous planets with rocky cores. The first is orbiting the star 47 Ursea (approximately 40 light-years away) which has a mass of about 3.5 Jupiters and an orbit somewhere between that of Mars and Jupiter. This planet has roughly Jupiter's mass and a Jupiter-like orbit that looks like it could fit into our solar system. The second is the planet around 70 Virginis (about 70 light-years away) which is about 8 Jupiters in mass and 4/10 the distance of the Earth from the Sun. Because of its distance from the star, the temperature at the cloud tops is estimated to be about 85oC which is "just right" for liquid water and has been dubbed the "Goldilocks" planet
Excerpts from:
Background: In order to provide the student with an appreciation of the range of the electromagnetic spectrum, images of the Sun will be examined in the visible, H-alpha(red), Ca-K line (blue?), radio, and x-ray The images will be taken from the same day so that features visible in one wavelength can be compared to features in another wavelength. The differences in the Sun's image are caused by the fact that different parts of the Sun produce different frequencies of radiation. For example, x-rays are produced by the corona and so an image in x-ray wavelengths, will show the corona of the Sun. Since the photosphere and chromosphere do not produce x-rays, the disc of the Sun appears black in x-ray images.
Student Handout:PROBLEM:
IMAGES OF THE SUN:
All images are from July 8, 1996. Since we are in a period of minimum sunspot activity, there are few features on the Sun. Read the description for each image and then click on the underscored section of the description to view the image. To return to this screen, click on the BACK button at the top of the screen.

Last Modified March 12, 1997.