Home
Up
Search
News
Facts
Science
Data/Software
The RHESSI Team
Public Outreach
Presentations
Messages
Related Sites


Other RHESSI
Web Sites

FORCE LIMITED VIBRATION TEST OF HESSI IMAGER

Deborah Amato, NASA Goddard Space Flight Center, USA;

David Pankow, University of California, Berkeley, Space Sciences Laboratory, USA;

Knud Thomsen, Paul Scherrer Institut, Switzerland


NASA Goddard Space Flight Center

Greenbelt, Maryland, 20771

USA

deborah.amato@gsfc.nasa.gov

Abstract

The High Energy Solar Spectroscopic Imager (HESSI) is a solar x-ray and gamma-ray observatory scheduled for launch in November 2000. Vibration testing of the HESSI imager flight unit was performed in August 1999. The HESSI imager consists of a composite metering tube, two aluminum trays mounted to the tube on titanium flexure mounts, and nine modulation grids mounted on each tray. The vibration tests were acceleration controlled and force limited, in order to prevent overtesting. The force limited strategy reduced the shaker force and notched the acceleration at resonances. The test set-up, test levels, and results are presented. The development of the force limits is also discussed. The imager successfully survived the vibration testing.

INTRODUCTION

The High Energy Solar Spectroscopic Imager (HESSI) project is a collaboration of investigators from many organizations, including the University of California, Berkeley, Space Sciences Laboratory (SSL), NASA Goddard Space Flight Center (GSFC) in Greenbelt, Maryland, the Paul Scherrer Institut (PSI) in Villigen, Switzerland, and Spectrum Astro in Gilbert, Arizona. Once in orbit, HESSI will monitor the Sun’s x-ray and gamma-ray emissions. The HESSI instrument consists of an imaging telescope, referred to as the imager, and a spectrometer. PSI conducted the imager integration and testing program. The flight imager was vibration tested on August 30 and 31, 1999 at Oerlikon Contraves Space in Zurich, Switzerland. The HESSI imager vibration test set-up, test levels, development of the force limits, and results are presented.

The vibration tests were acceleration controlled and force limited to prevent overtesting. The addition of the force limiting allowed the shaker input to be reduced by automatically notching the acceleration at resonances. A typical vibration test acceleration specification envelopes and smooths the actual anticipated flight environment. However, this input acceleration is unrealistic because, in flight, the acceleration is notched at resonant frequencies.

This notching results from the similarity between the mechanical impedance of the mounting structure and test item. The interface force is greatly increased in testing at resonances because the vibration table has a very high mechanical impedance and provides the enveloped interface acceleration, whereas in fight, the force is limited as the acceleration is reduced or notched. Force limiting provides a straightforward method of automatically notching the acceleration at a test item’s resonances, by measuring and limiting the reaction force between the test item and the shaker table. Manual notching of acceleration input is time consuming, requires extensive instrumentation, and depends on analysis, rather than validating analysis.

TEST SET-UP

The HESSI imager consists of a composite metering tube, two aluminum trays mounted to the tube on titanium flexure mounts, and nine modulation grids mounted on each tray. The Solar Aspect System (SAS) lenses and electronics are also mounted on the trays, and a thin protective mask is mounted to the tube, around the front tray and grids. The major imager components can be seen in Figure 1. The imager has three hard point mounts to the spacecraft bus or ground testing hardware. One pair of imager mounting struts and one of the three hard point mounts can be seen in the figure. The HESSI imager was tested in its flight configuration with the exception of a minor amount of cabling and the multi-layered insulation blankets.

.

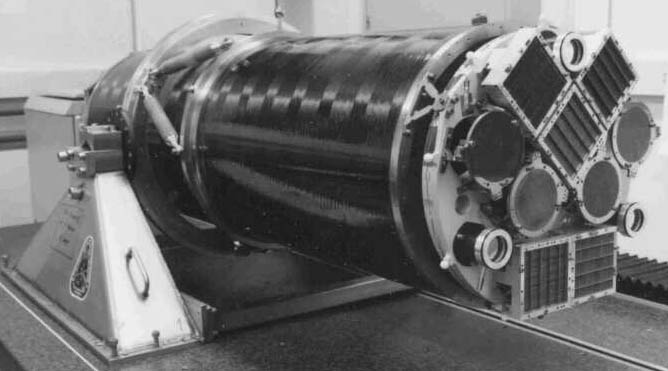
Figure 1 HESSI Flight Imager on a test stand at PSI. (The front mask is not pictured.)


The imager was tested in the vibration test facility at Oerlikon Contraves Space in Zurich, Switzerland. For testing, the imager was mounted to a substantial test fixture, which was mounted to the vibration slip table. Three force gauges were mounted between the imager hard point mounts and an interface ring to the vibration test fixture. Three triaxial piezoelectric force transducers (Kistler model 9167A1.5) were used. The force transducers were preloaded to 80,000 N so that they would operate in compression and effectively transmit the shear forces without exceeding the manufacturer's specifications. Figure 2 is a sketch of the vibration test fixture and shows the location of the imager mounting points for testing in the X- and Z-axes.

The imager, force gauges, and interface ring were rotated 90 degrees for Y-axis testing. Several accelerometers were mounted on the imager, test fixture, and vibration table for test control and collection of response data. The force gauges were connected through a Kistler 5017A1811 six-component charge and summing amplifier that provided voltages to the vibration control system for force limiting.

In order to verify that the control system and force limiting were working properly for testing of the flight unit and to gain experience with the force limiting set-up, the empty fixture was characterized first, then the qualification model imager was installed and tested. The flight imager was then installed for vibration testing.


TESTS AND TEST LEVELS

The HESSI flight imager was tested to acceptance level random vibration loads to verify its integrity and ability to maintain alignment. The HESSI imager was vibration tested in three orthogonal axes from 20 to 2000 Hz. The duration of each full level test was one minute. In each axis, a low level sine sweep was performed before and after the random vibration run. The sine sweeps were compared to determine if any major change in resonance frequency or amplitude occurred. Visual inspection of the imager and optical measurement of the imager alignment to micron accuracy were also performed after all testing was complete.

Acceleration Specification

The loads used for the acceptance level random vibration testing were scaled down by -3dB from qualification testing completed in December 1998. The loads were also scaled for the actual mass of the test item of about 46 kg. Table 1 lists the HESSI imager qualification and acceptance level loads adapted from the GSFC General Environmental Verification Specification.1 The acceptance levels for the flight imager testing are plotted in Figure 3 in the RESULTS section.

Table 1 HESSI Imager random vibration acceleration loads.


Acceleration Spectral Density [G2/Hz]

Frequency [Hz]

Acceptance Levels

Qualification Levels

20

.0063

.0104

50

.0390

.0637

800

.0390

.0637

2000

.0063

.0104

Overall

7.0 Grms

8.9 Grms

Force Limit Development

The force limits were developed by estimation using the semi-empirical method as described in "Force Limited Vibration Testing Monograph."2 Following Equation 29 in reference 2, the force spectral density, SFF in N2/Hz, is calculated from the acceleration spectral density, SAA in G2/Hz, according to the following expressions.

                     (1)

C is a configuration constant, mass is the test item mass in kg, f is the frequency in Hz, and fo is the first resonant frequency. The force limit profile was thus rolled off for frequencies above the first resonance or first significant imager mode. C is chosen based on judgment and comparison to similar configurations. C was chosen to be 2 for the HESSI imager tests.

In each axis, -18dB, -12dB, -6dB, and full level tests were run. Beginning with reduced levels and stepping up slowly allowed for review of the force data at each step. After each test, the force data were reviewed to predict the full level Grms response and to determine if the force limits needed to be adjusted. This prediction was compared to the structural flight loads requirements for the imager, which are 9.2 G in the axial direction (Z-axis) and 7.5 G in the radial direction (X- and Y-axes). The sine sweep response data were also reviewed to calibrate the force transducers and determine if any adjustments needed to be made to the force limits. The force limit profile is given in Table 2 for each axis and plotted in Figure 4 and 6 for the Z- and Y-axes.

The HESSI imager testing began with the Z-axis. The test was extremal controlled with two accelerometers in the direction of testing located at the imager hard point mount 1 (see Figure 2) and on the vibration table. The force limits were applied to the sum of the forces in the Z direction (S Z Forces in Table 2). The force spectral density was calculated as discussed above, using 50 kg as a conservative rounding up of the test item mass, and a first resonance of 200 Hz (fo = 100), since the first mode of the imager in the Z-axis is about 150 Hz. During Z-axis testing, considerable high frequency response from the shaker table that was difficult to control was discovered. In order to minimize this problem, the acceleration input was decreased by -20 dB per octave from 200 to 2000 Hz, in addition to employing the force limits specified, which did not compromise the test.

The X-axis test was extremal controlled with two accelerometers in the direction of testing located at imager mount 1 and on the vibration table. The force limits were applied to the sum of the forces in the X direction (S X Forces in Table 2) and to the force in the Z direction at imager mount 2 (Z2), shown in Figure 2. The force spectral density was calculated using 46 kg for the test item mass and an fo of 125 Hz, since the first modes of the imager in the X- and Y-axes are about 47 and 85 Hz. For the X- and Y-axes a more accurate test item mass was used. To avoid the high frequency shaker table response, the force limit specification and the acceleration input was rolled off by –20 dB/oct for frequencies from 125 to 2000 Hz. This roll off is slightly steeper than the (fo/f)2 roll off of Equation 1. The X-axis force limits had to be further modified due to low force sensor readings seen in the X-axis sine sweep calibration. With a 0.25 G input at 20 Hz, the sum of the forces in the X direction was 90 N. The output should have been 114 N. The force spectral density was multiplied by the factor 0.623 to compensate for this difference.

                                 (2)

The Y-axis test was extremal controlled with two accelerometers in the direction of testing located at imager mount 1 and on the vibration table. The force limits were applied to the sum of the forces in the Y direction and to the force in the Z direction at imager mount 1 (S Y Forces and Z1 in Table 2). The force limits were prepared as for the X-axis with a 46 kg test item mass, an fo of 125 Hz, and a –20 dB/oct roll off for frequencies above 125 Hz. During the low level random vibration tests some rattling of the largest modulation grids was heard and was expected to increase with increasing levels. The predicted full level response was also higher than necessary. After the -12 dB test, the prediction for the full level response was 8.4 Grms, whereas the limit load is 7.5 G. The ratio of these levels squared is 0.8. Because of the rattling and high overall response prediction, the Y-axis limits were further reduced by a factor of 0.5 instead of 0.8, to be conservative.

Table 2 Force limits for each axis of the HESSI Imager random vibration testing.

(The Z- and Y- axis force limits are plotted in Figures 4 and 6.)


Force Spectral Density [kN2/Hz]  

Z-axis

X-axis

Y-axis

Frequency [Hz]

S Z Forces

S X Forces

Z2

S Y Forces

Z1

20

.0061

.0032

.0016

.0026

.0013

50

.0375

.0200

.0100

.0160

.0080

125

.0375

.0200

.0100

.0160

.0080

200

.0375

-20 dB/oct

-20 dB/oct

-20 dB/oct

-20 dB/oct

800

.0006

-20 dB/oct

-20 dB/oct

-20 dB/oct

-20 dB/oct

2000

1.5x10⁻⁵

-20 dB/oct

-20 dB/oct

-20 dB/oct

-20 dB/oct

"S A Forces" is the sum of the A-axis forces. "Zn" is the force in the Z direction at mount n of Figure 2.

RESULTS

The acceleration input and force limited response for the Y- and Z-axes are shown in Figures 3 through 6. The X-axis input and force response is very similar to the Y-axis. Notches in the acceleration input that are a direct result of the force limiting are clearly visible in both Figure 3 and 5. The center of gravity acceleration in G’s is calculated using the following equation.

                         (3)

where S Faxis is the sum of the forces in the axis testing direction expressed in N. The rms sum of the forces in the Z direction for the Z-axis full level random vibration test was 1.868 kN, and the center of gravity (CG) acceleration was 12.4 G. For the X-axis full level test, the measured sum of the forces in the X direction was 0.745 kN. This value must be adjusted by the correction factor of 0.789 from Equation 2 to obtain the actual sum of the forces, 0.944 kN. The CG acceleration in the X-axis was 6.2 G. The sum of the forces in the Y direction for the full level Y-axis test was 0.785 kN, and the CG acceleration was 5.2 G. These test results are summarized in Table 3.

Table 3 Center of gravity accelerations from the HESSI flight imager random vibration testing.


Z-axis

X-axis

Y-axis

Sum of the forces in the test direction

1.868 kN

0.944 kN

0.785 kN

CG Acceleration

12.4 G

6.2 G

5.2 G

Figure 3 Z-axis acceleration input with notches from the force limiting in the HESSI Imager acceptance level random vibration test.

Figure 4 Total Z-axis force limited to specification in the HESSI Imager acceptance level random vibration test.

Figure 5 HESSI Imager Y-axis acceptance level random vibration test acceleration input with notches from the force limiting.


Figure 6 Total Y-axis force spectrum limited by specification in the HESSI Imager Y-axis acceptance level random vibration test.

Force Limiting Benefit For Sensitive Imager Components

The most sensitive components on the imager are the modulation grids, grid mounts, and SAS lenses, all of which are mounted to the trays at either end of the imager tube. Force limiting provided a significant reduction in acceleration response on the trays compared to testing with acceleration control only. Grid acceptance testing levels were developed from the imager qualification testing completed in December 1998. No force limiting was used for the grid acceptance tests. The input acceleration specification was 8.62 Grms for the X- and Y-axes, and 12.82 Grms for the Z-axis. The tray response levels measured during grid acceptance testing were 9.0 Grms in the X- and Y-axes tests and 14.9 Grms in the Z-axis test. The response accelerations on the tray measured during the force limited imager acceptance test were 3.2 Grms in the X-axis test, 2.8 Grms in the Y-axis test, and 6.1 Grms in the Z-axis test. The force limiting used in the HESSI flight imager vibration testing resulted in better than a factor of 2 reduction in the overall acceleration loads that the grids had to withstand during grid acceptance testing.

SUMMARY

The HESSI flight imager successfully survived acceptance level vibration testing. Post-test visual inspection of the imager and measurement of the alignment showed no degradation. Force limiting of the vibration tests prevented unnecessary overtesting by reducing the loads applied to the imager and automatically notching the acceleration at the imager resonances. The loads applied to the most sensitive imager components during this testing were reduced by a factor of 2 or better as compared to acceleration controlled testing without force limiting. Force limiting was a useful tool in the successful testing of the HESSI imager.

ACKNOWLEDGEMENTS

The authors wish to thank Terry Scharton of the Jet Propulsion Laboratory for his advice and assistance in preparing for and performing the HESSI imager vibration tests.

REFERENCES


  1. „General Environmental Verification Specification for STS and ELV Payloads, Subsystems, and Components, Revision A", GEVS-SE (June 1996)
  2.  

  3. T.D. Scharton, „Force Limited Vibration Testing Monograph", NASA-RP-1403, Section 4.2 (May 1997)

Home Search News Facts Science Instrument Data/Software The RHESSI Team Public Outreach Presentations Messages Related Sites
 

Link to NASA Home Page

Responsible NASA Official:  Gordon D. Holman

Web Design:  Merrick Berg, Brian Dennis, Gordon Holman, & Gilbert Prevost

Heliophysics Science Division
NASA/Goddard Space Flight Center
Laboratory for Solar Physics/ Code 671
Greenbelt, MD, 20771, USA
Gordon.D.Holman@nasa.gov

Link to NASA/Goddard Home Page

+ NASA Privacy Statement, Disclaimer, and Accessibility Certification

This site last updated November 10, 2008.