Spectrogram Plot Options Widget
Click here to see the full PLOTMAN Guide
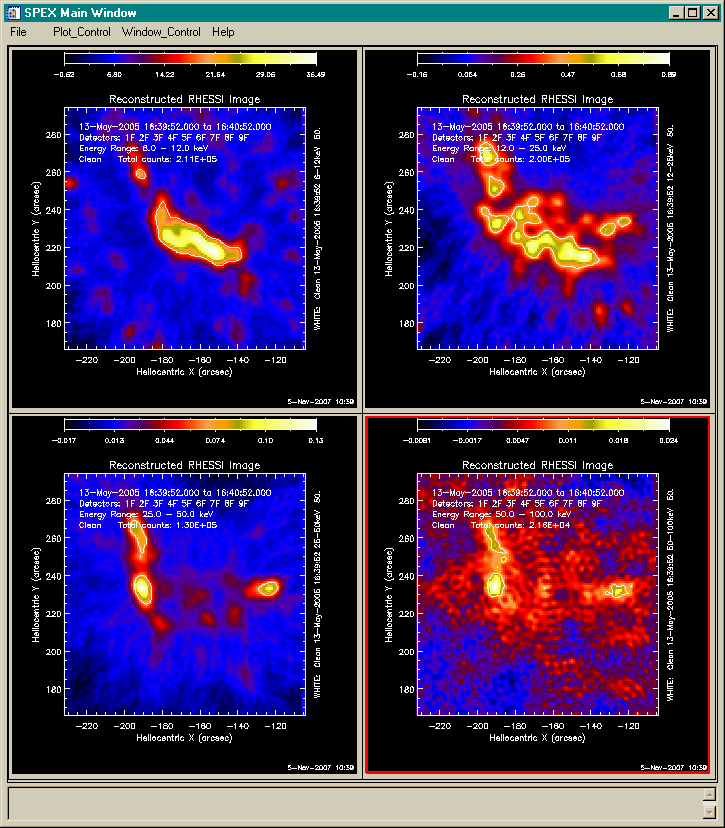
This is a snapshot of a PLOTMAN widget showing images of a RHESSI flare in four energy bands with a 50% contour overlaid. Notice the red border around the bottom right plot. The red border indicates that that plot is the current active plot, and any manipulation you do through the File or Plot_Control pull-down menus will apply to that plot.
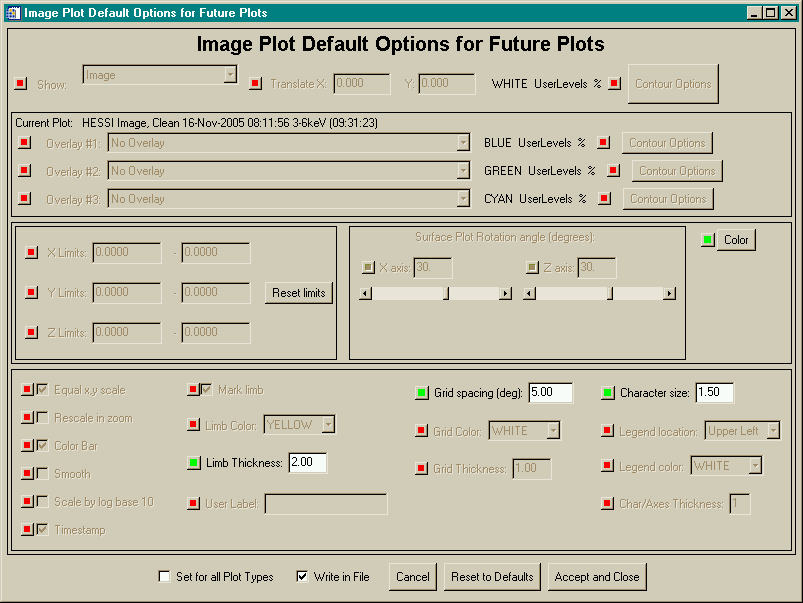
This is a snapshot of the Widget for setting Image Display Defaults in PLOTMAN. This widget is activated when you click
1. File / 'Set Plot Preferences' or
2. Window_Control / 'Multi-Panel Options' / 'Change Plot Options'
In this example, user preferences for image color table, limb thickness, grid spacing and character size have been selected.
Note: there is a similar interface for setting XY, UT, and Spectrogram default options.
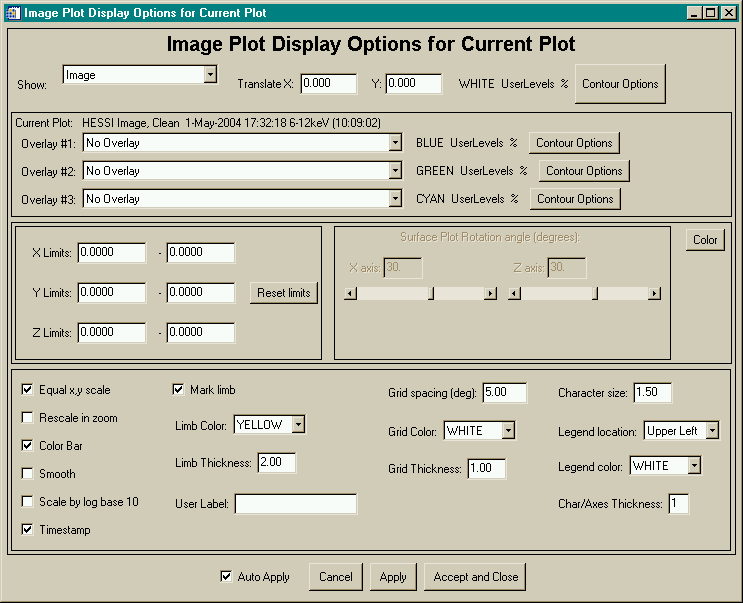
This is a snapshot of the Image Display Options Widget in PLOTMAN. This widget is activated when you click Plot_Control / 'Image Display Options'.
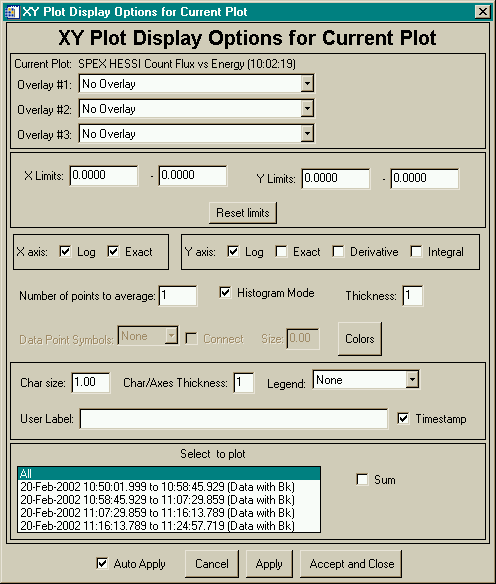
This is a snapshot of the XY Plot Display Options Widget in PLOTMAN. This widget is activated when you click Plot_Control / 'XY/UT PLOT Display Options'.
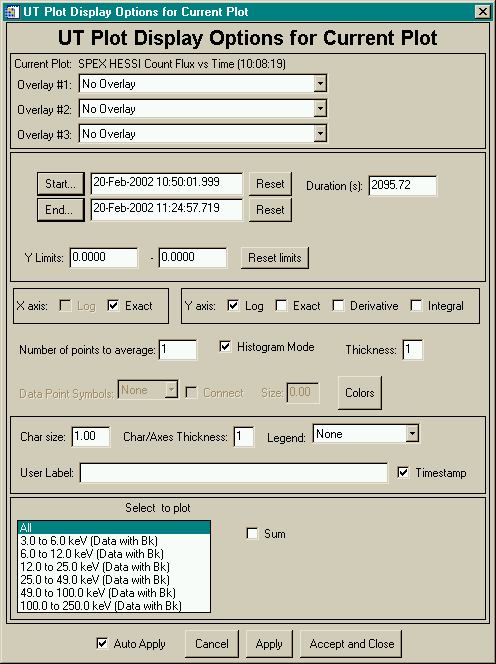
This is a snapshot of the UT Plot Display Options Widget in PLOTMAN. This widget is activated when you click Plot_Control / 'XY/UT PLOT Display Options'.
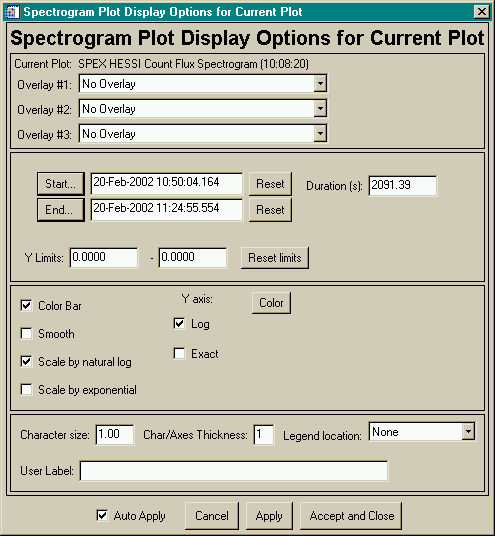
This is a snapshot of the Spectrogram Plot Display Options Widget in PLOTMAN. This widget is activated when you click Plot_Control / 'Spectrogram PLOT Display Options'.
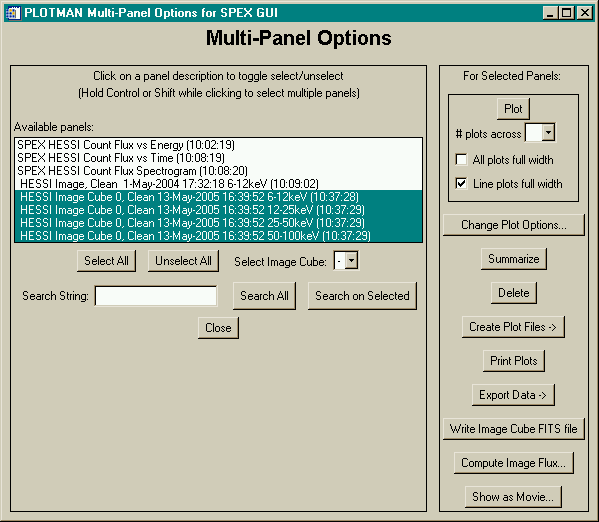
This is a snapshot of the widget for manipulating or plotting multiple PLOTMAN panels together. This widget is activated when you click Window_Control / 'Multi-Panel Options'.
Last updated 05 November, 2007 by Kim Tolbert, 301-286-3965