(The vertical dashed lines separate the grids)
|
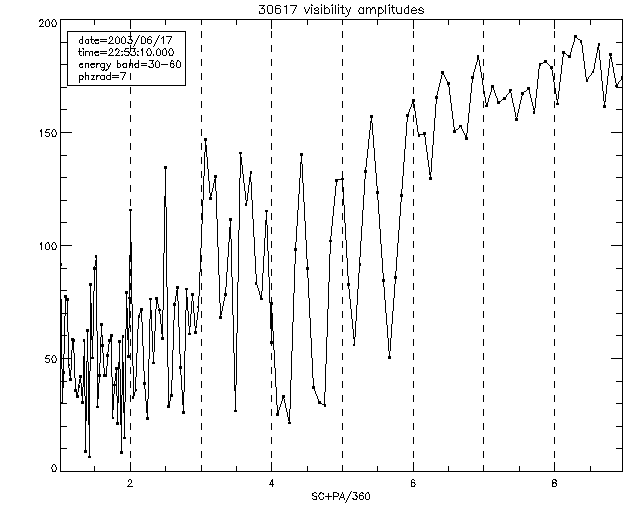
Observed 2003/06/17 visibility amplitudes (The vertical dashed lines separate the grids) |
|
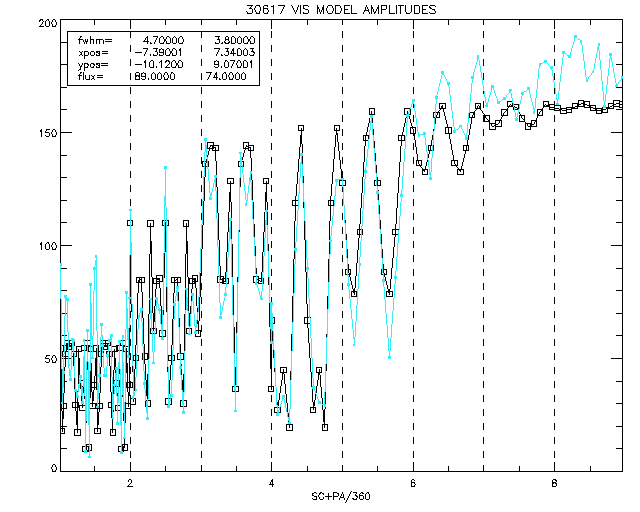
| VIS MODEL AMPLITUDES for 2003/06/17 (The blue curves are the observed amplitudes) Note how well the model and observed peaks agree in PA |
 |
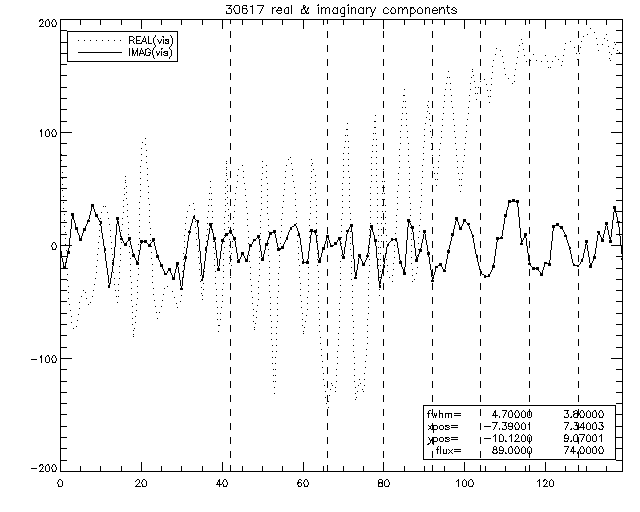
| Observed 2003/06/17 real & imaginary components Note the double peaks as function of PA for the imaginary component and single peaks for the real component |
 |
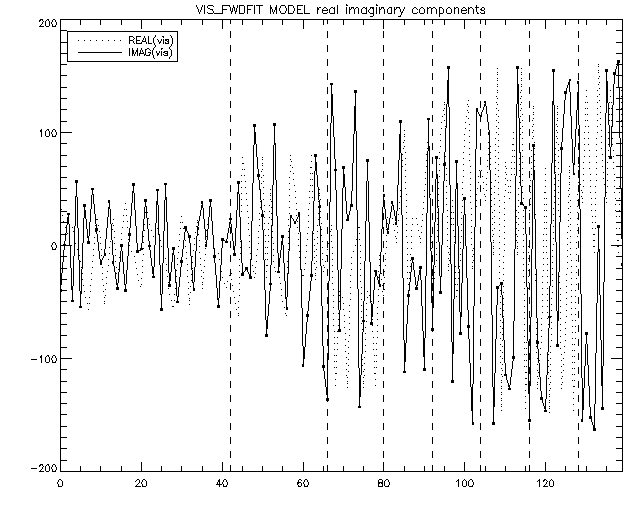
| VIS_FWDFIT MODEL real imaginary components The puzzle is how different the model imaginary/real components behave as compared with their observed counterparts, although the amplitudes agree well. Where does the additional modulation arise? If the source positions were wrong, the model amplitudes would not match the observed values. (Can it have anything to do with neglecting the 2nd harmonic which was included in the visibilities?) |
 |
| MODEL PHASE For the coarser grids (5-9), the phase seems to change nearly sinusoidally, with roughly the same amplitude (~ 90 deg). The behavior is more complicated for the finer grids. Note that the phase is nearly zero, with weaker sinusoidal behavior for the true visibilities grids 5-9. The amplitude of the phase variation would decline with decreasing wavenumber (increasing pitch) if the phase center were wrong, so the the cause must be elsewhere. It appears that (at least for grids 5-9) the visibility profile is being multiplied by exp(i*c1*cos(PA+c2)), where PA is the position angle in radians, c1 is a constant independent of wavenumber k, and c2 depends on k, but not on PA, . |
 |