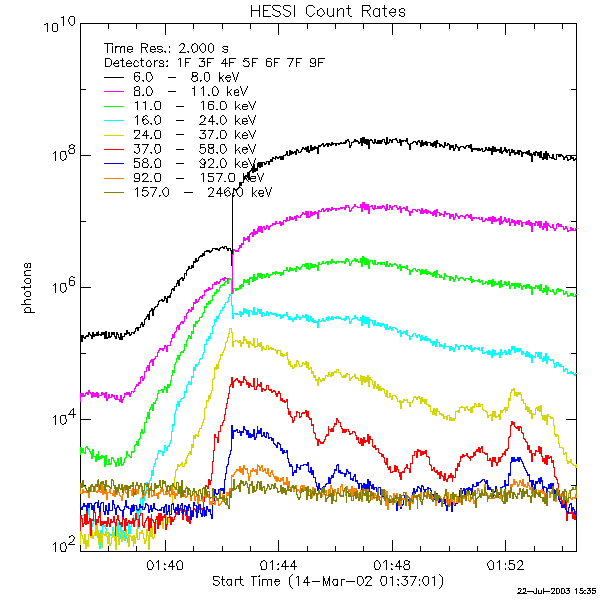
In the 12-30 keV band the flare started at 01:37 UT, peaked at 01:46 and continued after 01:54, the beginning of RHESSI night. RHESSI observed three minutes of the decay phase (02:31-02:34), and in soft X-rays (GOES) the flare continued until at least 04:00.
During the rise, countrates per detector reached and exceeded 50,000 counts/s, (the point at which pulse pile-up becomes significant) and the first attenuator automatically switched in at 01:42:20. This is seen in the discontinuity of the profiles of the lower energy bands. (The discontinuity has been approximately accounted for in computing the photon rate, but the finite width of the energy bands requires a complete treatment of the energy response matrix and modelling to eliminate the discontinuity altogether.)
The flux in the low energy bands (6-16 keV) continued to rise for a few minutes, but in the higher energy bands (24-92 keV), a number of impulsive bursts appeared at a cadence of ~1 min, each burst lasting for 30-60 s. This burstiness may also be seen in the RHESSI countrate spectrogram (courtesy of Pascal St-Hilaire, HEDC).
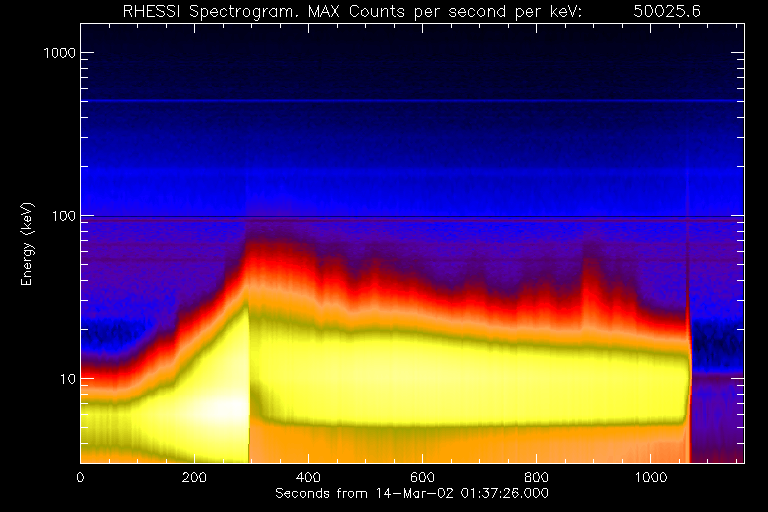
The burstiness of the flare is shown by the vertical spikes at the top of the red band in the spectrogram. Many of the spikes extend up to 70-80 keV. These have been analyzed spectroscopically (see Spectroscopy below).
The first image (01:41:50) shows a loop-like structure in the 12-15 keV band, and this "loop" appears to break up into discrete components above 19 keV. Above 45 keV, the source appears as 3 components, and above 55 keV, 2 components. Maps above 75 keV show little or no real structure because the S/N ratio has dropped below 1:1.
In the low-energy maps, artifacts (vertical bands) appear. These may be the result of the decay of a previous flare (seen in the time profile of Fig. 1), or to pulse pile-up near the end of the 1-min map interval. Quantitative interpretation of these first maps is therefore difficult.
After the attenuator switched in at 01:41:20, pile-up was no longer a problem, and the signal of the earlier flare was much reduced. Thus the Clean maps from 01:43:30 on are of good quality. In the first post-attenuator map at the peak of the flare, the loop-like nature of the source appears at low energies, and two discrete components ("footpoints") appear above 24 keV. Two footpoints may be seen clearly up to the 55-75 keV band, and one footpoint appears in the 75-100 keV band.
In subsequent maps, the low energy source (12-19 keV) appears first to contract, and then to expand. There is also a slight counter-clockwise rotation of the axis of the source. In view of the burstiness of the flare, it is probable that new loops are being energized, and it is difficult to distinguish this from a real motion of the loop.
As a function of energy, the maps from 01:43:30 to 01:50:00 show a decrease of map quality with increasing energy. The cutoff above which good maps cannot be made decreases from about 75 keV to 45 keV. At the highest mappable energies in this time range, all the sources appear as double sources, and there is a clear tendency for the line connecting the two components to rotate counter-clockwiase. Thus the eastern footpoint moves north and the western footpoint moves south.
At 01:52:00 a larger burst appears, and the two-components of the source may be seen up into the 55-75 keV band. At this time there appears to be a clear rotation of the line connecting the footpoints clockwise with increasing energy. In the 55-75 keV band, the western footpoint is slightly south of the eastern footpoint, while in the 24-30 keV band the eastern footpoint is slightly south of the western footpoint. The continuing "tilt" continues to lower energies. If this is interpreted as a single loop, the maps indicate that the loop is distorted out of planarity, since the higher energy photons come from lower in the loop's legs, and the lowest energies come from the top of the loop.
The black crosses show the background-subtracted data with error bars in flux and energy-bandwidth. The red triangles show the background that was subtracted. The green line shows the powerlaw component, and the blue dots show the thermal component. The temperature and emission measure, as indicated by the height and width of the model thermal fit, change relatively slowly during the event.
The fits to T, EM, F_50 and index are shown in Fig 5.
(a) The emission measure decreases from about 5x10^3 cm^{-3} to less than 10^3. (After 01:46, the values are invalid, and are being re-done.)
(b) The model temperature rises until 01:46 and declines steadily for the remainder of the flare.
(c) The nonthermal flux is highest at 01:42 and decreases montonically until a small burst at 01:46 occurs, and then peaks again in a second, larger, burst at 01:52:30.
(d) The spectrum softens from an initial index of 3.0 to about 6, when it hardens in the small burst at 01:46. Hardenings again occur in later bursts at 01:49, 01:51, and 01:52:30. the spectrum finally softens to an index greater than 9 at 01:53.
(1) See http://sprg.ssl.berkeley.edu/~emily_r/overview_plots.html for GOES and HXR plots.
(2) Schwartz, R.A., 1996, Technical Report, NASA GSFC
Smith et al, Solar Physics, 210, 33, 2002.