Using MEM_Sato
- A warning at the outset: This is not a definitive tutorial.
- MEM_sato has several unexpected and undocumented features.
- Experts on MEM_Sato are few and far between, and I am not one of them.
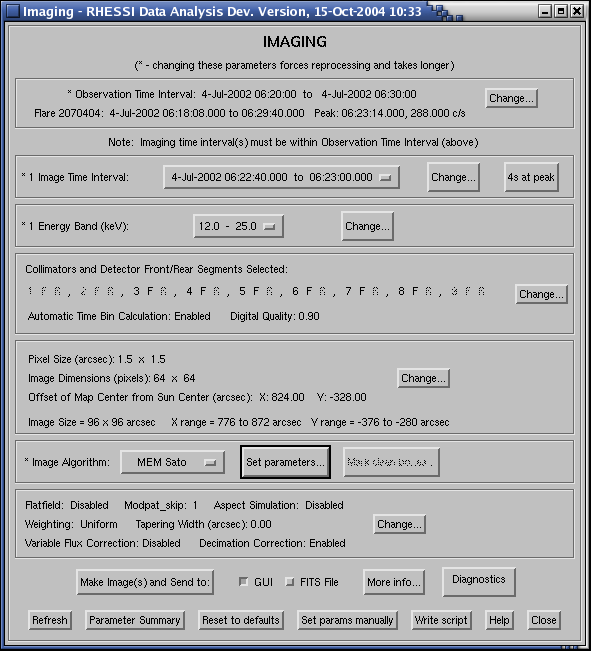
Just as in previous tutorials, start up the gui and enter the
time of your favorite flare. In this example, I have used a
20-s interval of the 2002 July 4 flare. I use detectors 3F-8F,
1.5 arcsec pixels, and energy band 12-25 keV.

After setting the imaging algorithm to MEM_Sato, pull down the
"Set parameters" menu.
| Note the option called "Smoothness constraint".
This is not really a smoothness parameter, but it
is supposed to weight the entropy term relative to the
chisquare term. The default value is 0.1. We have set the
parameter to 4 values, 0.025, 0.100, 0.400, and 1.0, and
made maps, as shown below.
|
 |

There are no significant differences in these maps. Further, all 4 maps
have similar values of chisquare. (Recall the 3-pixel likelihood
hypercube.) This is an
undesirable "feature" of MEM_Sato (noted by Andrew Conway in Dec/2001)
in which the "entropy constraint" is effectively turned off for
lnorm > 0.1.
Another "feature" is the
well-known super-resolution of MEM images. To
see this, open the Plot_control menu, and create a column
profile.

As shown here, the FWHM of the selected source is about 4.5". This is less
than the 6.9" resolution of subcollimator 3, the finest used in these maps.
This means that, if the mapped flux equals the true flux, then, in addition to
underestimating the size of sources, the maps also overestimate the source
intensity.
CAVEATS
- Use MEM_Sato with care, testing it against other methods.
- Be aware that the Lnorm parameter does not work as expected.
- As in all MEM imaging, map sources can exhibit super resolution.
- Source intensities (and contrast) may be over estimated
(however, Aschwanden et al. have, in other cases, found the reverse!)
WISH LIST
- MEM_Sato should convolve the map with the PSF to get
realistic source sizes.
- Residuals should be added back into the map (as done by Clean), so the
image "background" is realistic.
- A one-dimensional "core" through the likelihood matrix for selected
pixels would provide the "sigma" for those pixels (W. Cash 1978).
- Selected cross sections of the likelihood hypercube would provide
useful diagnostics for convergence properties.
- Volunteers are solicited to improve MEM_Sato and make it competitive
with the other imaging algorithms.


