Nov 20, 2001
 |
| png version |
|
|
| Postscript version |
|
2. Gordon's Memo
Gordon hurford wrote:
This memo describes a small error in the current normalization of our
back projection maps. It is not a serious problem. Its primary effect
is to slightly compromise their quantitative interpretation. In unusual
circumstances the error may also influence the selection of components
in the CLEAN algorithm. It should have no effect on the output of MEM,
Forward Fitting, etc.
The advertised normalization of currently implemented backprojection
maps (with flatfielding) is that for single point source, the peak of
the map is equal the incident photons per subcollimator (assuming
perfect 40 cm2 detectors and no windows or attenuator). The back
projection algorithm used to achieve this makes the assumption that
there is no correlation between the rapidly varying modulation term
(1+cosine[phase]) in the modulated light curve and the grid transmission
term (which has two cusp-like peaks per rotation due to grid
shadowing). This assumption is pretty good, but it is not perfect,
since the slow part of the modulation cycle coincides with the cusp-like
peaks in the envelope to the modulated light curves. The consequence of
this correlation is that the peak of a back projection map, (after flat
fielding) will be in error by a few percent.
The effect can be evaluated numerically and might be represented as a
"renormalization map" of which is the factor by which the back
projection map should be multiplied to remove the effect. We might
represent this factor as 1+alpha(x,y), where alpha<<1.
For fixed pointing, and half=integral rotations, such a renormalization
map has the familiar target appearance, centered on the rotation axis.
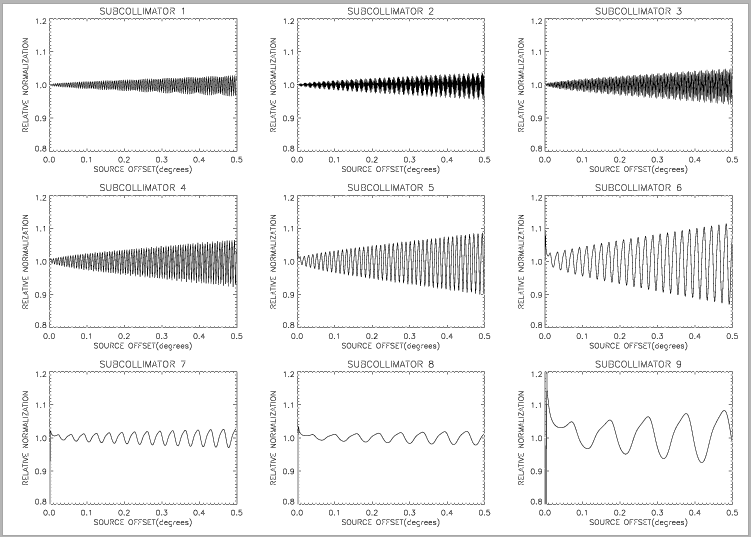
Plots of the radial dependence of 1+alpha for each subcollimator are
shown in the attached .ps file. The main features are:
1. 1+alpha oscillates about 1. The rapid oscillation with radius
probably makes it infeasible to apply this correction in practice.
2. The envelope to alpha increases in direct proportional to the radial
offset for offsets larger than about angularpitch/2. That is, the
effect is
largest for sources well away from the axis of rotation. This is
because
the grid shadowing becomes more prominent.
3. The envelope to alpha scales as (pitch/FOV)^(0.25). This implies
that it is largest for subcollimator 6 and smallest for subcollimator
8. For subcollimator 6 at 0.2 degrees, the envelope to alpha is about
+-5%.
Bottom line is that this is not a serious problem, but one which might
be kept in mind if backprojection maps are scrutinized carefully. No
corrective software changes are recommended.
3. The Correction
There is an easily-applied correction to the back-projection maps
using the calibrated eventlist (which has to be available to make the
back-projection map anyway), and it can be written in the following
way:
For a point source, the relation between the max in the flat-fielded
map and the total counts (Ctotal) is simply,
Max = Ctotal / <Pm>
where <Pm> is the rotationally-averaged probability Pim of passage thru the subcollimator.
For this, we should use the form (see RHESSI Imaging Concept):
Pim = gridtran*(1 + modamp * cos(phase_map_ctr + K.Rm))
At map center (where the maximum is presumed to be), Rm =0.
So all the quantities are available in the calibrated eventlist to get
<Pm>.
For a calibrated eventlist structure cbe for a single grid,
<Pm> = mean(cbe.gridtran*(1. + cbe.modamp * cos(cbe.phase_map_ctr) )
We have been using <Pm> = mean(gridtran)
erroneously in calculating relative amplitudes:
<Pm> can depart from mean(gridtran) by of order 15%
for real data (e.g. the flare of Apr 20, 2002).
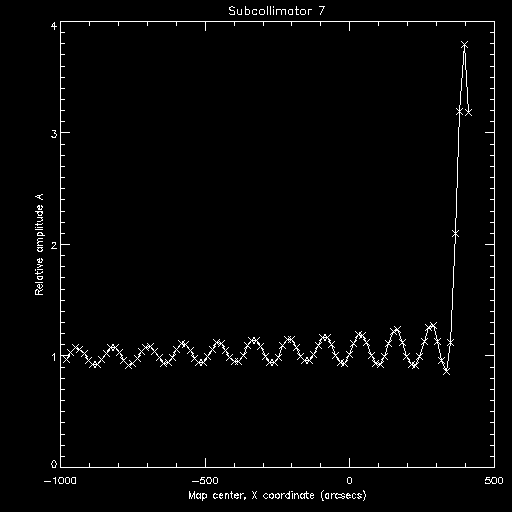
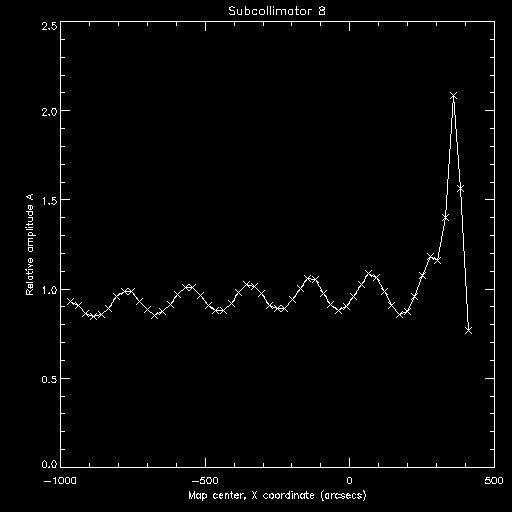
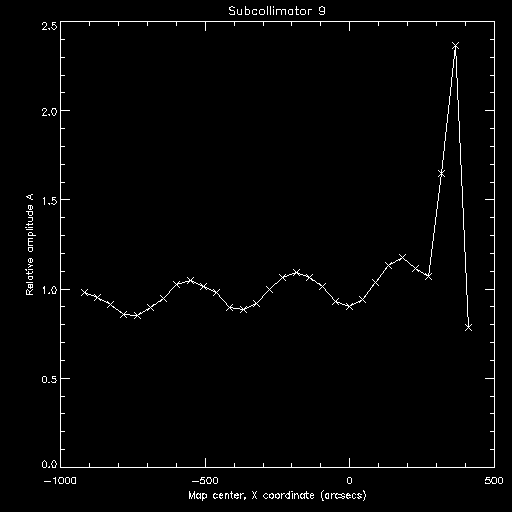
When <P_m> is used, the ripple found by Pascal above goes away, as shown in this plot of
corrected relative amplitudes vs position.
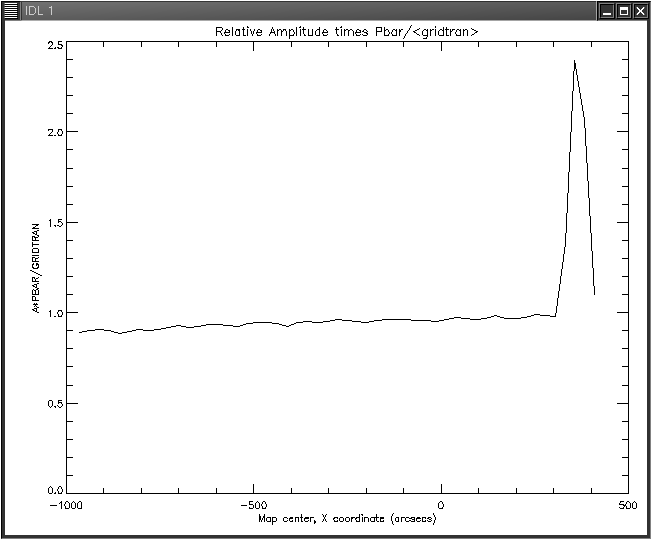
There is still a small "ramp" in the relative amplitude dependence.
The relative amplitude seems to decrease montonically from close to the
spin axis to the 1000" away. The source of this error is unknown.
Ed Schmahl
Last modified: Tue Nov 19 11:34:09 EST 2002