GOES IDL User Guide
Dominic Zarro (ADNET/GSFC) and Kim Tolbert (AU/GSFC)
NEW: GOES EUV Data added May 2016
Data from multiple generations of Geostationary Operational
Environmental Satellites (GOES) since 1976 are
available. Each GOES satellite carries an X-Ray Sensor (XRS) consisting
of two ionization chambers to measure the total solar flux in two
wavelength bands, 0.5 - 4 and 1 - 8 Angstroms. In addition, since
GOES13 (launched in 2006), the GOES satellites have carried an
Extreme Ultraviolet Sensor (EUVS) which measures the EUV in 5 bands
from ~5-127 nm.
IDL software distributed in SolarSoft (SSW) provides an easy
way to access and analyze the GOES XRS and EUV lightcurve data. The
goes IDL
class in SSW creates a GOES lightcuve object that users control from the
IDL command line, a GUI interface, or a combination of the two.
| Important Note about GOES Scaling |
For GOES 8 and later, the fluxes in the data archived at NOAA, and therefore also in the Goddard SDAC and YOHKOH archives used as input to the GOES object, have had scaling factors applied. These scaling factors were applied to force the GOES>=8 fluxes to match the GOES<8 fluxes (which were found to be incorrect) so that flux levels and class levels (A, B, C, M, X) are consistent over the more than 30 years of GOES solar observations. To get true fluxes from the archived data, users should divide short channel fluxes by 0.85 and divide long channel fluxes by 0.7.
In the GOES object, we have NOT applied these corrections to get the true flux. The only exception to that is that internally, when we calculate the temperature and emission measure, we do apply the corrections for GOES>=8 because the transfer functions provided by NOAA to convert between current and watts/m^2 apply to the corrected data for GOES>=8. The lrad output option in the object (total radiative energy loss rate) is derived from the emission measure and temperature, therefore the lrad calculation uses the corrected flux. The lx output option (X-ray energy loss rate) is derived from the fluxes directly and does NOT use the corrected flux.
|
The goes object automatically searches for and retrieves GOES data files
across the network for the time interval requested.
When the files are copied to the user's computer, they are placed in a
goes directory in the user's temporary directory (whatever is returned by
the function get_temp_dir() ).
XRS DATA
There are two GOES archives used by the goes object, -YOHKOH
(originally created for the YOHKOH project) and SDAC (Solar Data
Analysis Center) both stored on servers at GSFC. The two archives
are essentially the same; they serve as backup for each other. The
differences are:
- The YOHKOH files contain cleaned data, while the SDAC files contain
raw data, which is cleaned by default in the object
- The YOHKOH files have time resolutions of 3 seconds, 1 minute, and 5
minutes, while the SDAC files have only 3 second resolution.
- The YOHKOH files can be more up-to-date, sometimes within an hour of
the current time, while the SDAC files contain data through the end of
the day previous to the current time.
- The YOHKOH files are written in a yohkoh-specific weekly file
format; the SDAC files are daily files written in standard FITS
format.
Location and description of files (though, as mentioned above, the
software automatically retrieves them, so users don't need to know
this):
| SDAC daily FITS files:
http or ftp |
Files are organized in year directories.
Files are named goxxyyyymmdd.fits where xx is the GOES satellite
number and yyyymmdd is the year, month, day of the data, e.g.
go1020020723.fits contains GOES 10 data for 23-July-2002. |
| YOHKOH weekly files: http
or ftp |
Directories are named gnr
where n is the last digit of the satellite number, and r is the
resolution - 'd', '1', or '5' for 3-sec, 1-min, or 5-min data
resolution respectively), e.g. g01 contains GOES 10
1-minute data.
Files are named gnryy_wwa.01 where n is the last digit of the
satellite number, r is the resolution (d, 1, or 5), yy is the
last 2 digits of the year, and ww is the week of year number,
e.g. g0199_44a.01 contains GOES 10 1-minute data for week 44 of
year 1999. |
If the files are available locally (mounted via NFS or equivalent on
your computer, or copied manually to your computer), you can speed
things up by setting some environment variables so they can be read
directly instead of copied. For the SDAC GOES files, set the
environment variable GOES_FITS to the directory containing the GOES FITS
files. For the YOHKOH GOES files, set SSWDB to the directory
containing the ydb directory, and the SSW setup will take care of the
rest.
EUV DATA
We provide access to the GOES EUVA (2.8 - 20.6 nm), EUVB (2.8 - 36.4
nm), and EUVE (113.5 - 132.8 nm) data.
The GOES EUV data are in daily text files available via http
or ftp (although
as mentioned above, the software will automatically retrieve
them). The files are organized by EUV channel and year. For
example, the daily files from GOES 13, 14, and 15 for the EUVE channel
for the year 2012 are in the directory
http://hesperia.gsfc.nasa.gov/goes_euv/euve/2012/. The files are
named gxx_euvn_yyyymmdd.txt where xx is the GOES satellite number, n is
the channel (a, b, or e) and yyyymmdd is the year, month, day of the
data., e.g. g15_euve_20120908.txt contains the GOES15 EUVE data for
8-Sep-2012.
Use any of the following commands to start the GOES Workbench. Note
that you can work with the GOES Workbench and command line interface
interchangeably.
IDL> goes ;-- start the GOES GUI
IDL> goes, a ;-- start the GOES GUI and return GOES object reference
IDL> a->gui ;-- start GOES GUI with an existing GOES object
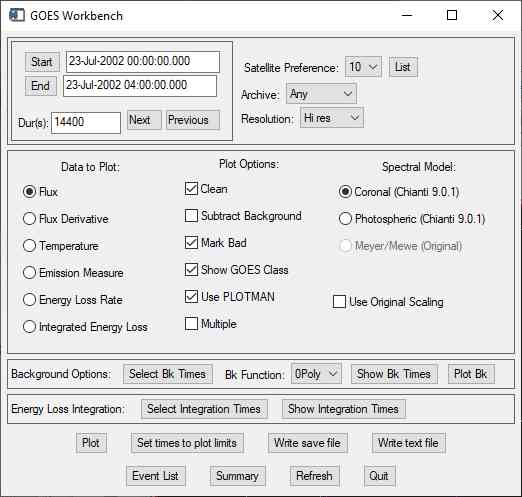
| Any of the commands above will bring up the widget
interface to the right.
Set the time interval you're interested in, and click Plot.
By default the lightcurve in the two channels will be plotted in
PLOTMAN (an interactive plot interface). The setup at right
produced this plot.

Clicking List will display a list of time periods covered by each
of the ~16 satellites in use since 1976.
Clicking Event List will display a list of all GOES events
(defined by NOAA) during the time interval selected.
Before plotting temperature, emission measure, or energy loss,
you may want to define background time intervals and a functional
form for estimating background throughout the flare, and click the
option to subtract background.
If you started the GUI using either the 'goes,a' or 'a->gui'
commands, then you have access to the goes object, a, at the
command line. You can use any of the commands described
below to set options or retrieve or plot the data. If you
change any options from the command line, click the Refresh button
on the GUI to reflect the new settings. And when you click
Quit, the object a is still available at the command line.
|
 |
To create a goes object without opening the GUI:
IDL> a = ogoes()
To create a goes object and open the GOES GUI:
IDL> goes, a
All of the commands below assume you have created a goes object called a
(either with or without the GUI).
All of the GOES parameters
and their default values are listed below. To change options, set
any of the parameters via the set command, or on the plot (or plotman or
getdata) command itself. Any parameter you set will persist until
changed explicitly. Use a->help to see current settings for all
parameters, or print,a->get(/xxx) to see the current value of parameter
xxx, e.g. print,a->get(/sdac).
And remember - any time you want to use the GUI with your existing
object, just type
IDL> a->gui
You can quit and restart the GUI any time with this object a.
To set the time interval, and satellite preference:
IDL> a->set, tstart='13-Nov-2005 12:33.12.123', tend='13-Nov-2005 16:12:34.567', sat='goes12'
All of the GOES
parameters and their default values are listed below.
IDL> a->plot ;-- plot GOES lightcurve
IDL> a->plotman ;-- plot GOES lightcurve in interactive plot interface
IDL> a->plot,'1-jun-04' ;-- plot a different day
IDL> a->plotman, '1-jun-04', '5-jun-04' ;-- plot four days
Note: If you specify times in seconds rather than one of the fully
qualified time formats, they will be interpreted as seconds since January
1,1958 (UTC or TAI), not 1979.
Example: To plot 18:00-19:00 on 22-mar-2002, 1-minute GOES data
from the YOHKOH archive, preferably GOES10, with no GOES class level
markings, you can do either of the following:
IDL> a->set, tstart='22-mar-2002 18:00', tend='22-mar-2002 19:00', $
   /yohkoh, sat='goes10', mode=1, showclass=0
IDL> a->plot
or
IDL> a->plot, tstart='22-mar-2002 18:00', tend='22-mar-2002 19:00', $
   /yohkoh, sat='goes10', mode=1, showclass=0
IDL> d = a->getdata() ;-- retrieve 2 channels of GOES data
IDL> help,data
   FLOAT = Array[115087, 2]
IDL> low=a->getdata(/low) ;-- extract low channel only
IDL> high=a->getdata(/high) ;-- extract high channel only
IDL> times = a->getdata(/times)          ;-- extract time array and UTBASE
IDL> utbase = a->get(/utbase)
IDL> utplot,times,high,utbase ;-- plot high channel data
IDL> deri=deriv(times,high)              ;-- take time derivative of high energy
                                         ;   channel (for Neupert Effect lovers)
NOTE: The data extracted will be cleaned and/or background-subtracted if
those options are set.
To retrieve all quantities with one call (see below
for more details):
IDL> data = a->getdata(/struct) ;-- extract data and derived quantities into a structure
To select EUV data, set the euv parameter to 1, 2 or 3 (for EUVA, EUVB,
or EUVE), e.g. to select EUVE, type
IDL > a->set, euv=3
Setting euv to 0 (or setting on of the sdac or yohkoh options) will
unselect EUV data.
Some of the options available for GOES XRS data are not available for the
EUV data, namely computing temperature, emission measure and energy loss
rate, and subtracting background. In the GUI, these options are
insensitive when EUV data are selected. At the command line, requesting
any of those computed data will return -1.
Each EUV channel, EUVA, EUVB, and EUVE contains only one channel.
Since the design of the GOES object was based on GOES XRS data, which has
2 channels, the data arrays returned in the getdata calls are dimensioned
[ntime, 2] where ntime is the number of time intervals. For XRS data
the second dimension contains the 1-8 Angstrom data in element 0, and the
.5-4 Angstrom data in element 1. For EUV data the data is in channel 0,
and channel 1 is set to all 0s (except for EUVE, see below).
The EUV files contain counts in each ~10 second interval. These
counts are converted to irradiance using the the tables and equations
provided in the
GOES EUVS document.
The EUVE channel stored in channel 0 of the data arrays is the irradiance
corrected for degradation and scaled to the SORCE SOLSTICE Lyman-alpha
measurements. This is what is plotted by default. The
uncorrected, unscaled irradiance is stored in channel 1, and can be
retrieved at the command line through the getdata call. The uncorrected
EUVE data can be plotted using the GOES object plot method via the command
(assuming EUVE data type is selected):
IDL> a->plot, /uncorrected
The time returned in the time array is the center of the data
accumulation interval.
The clean option also works a little differently for the EUV data than
for the XRS data. For the XRS data, bad data are identified from flags and
spike detection, removed, and interpolated over. For the EUV data,
bad data are identified from flags, but are not interpolated over.
Instead, they are set to a value of -99999.0. When plotting using
the GOES object plot method, the -99999.0 values are removed. When
plotting at the command line without using the GOES object plot method,
you will need to remove them yourself. Something like this should
work:
IDL> data = a->getdata(/struct)
IDL> q = where(data.yclean[*,0] ne -99999.)
IDL> utplot, data.tarray[q], d.yclean[q,0], utbase, /ynozero
To enable background subtraction, you must set the bsub option to 1 and
define one or more background time intervals.
Any number of background time intervals can be selected. The background
for each channel during the flare is computed by fitting the selected
function to the flux values in all of the background time intervals.
IDL> a->set, /bsub ;-- set bsub to 1
IDL> a->set, btimes= [ ['22-Mar-2002 18:12:54', '22-Mar-2002 18:14:36'], $
    ['22-Mar-2002 18:40:57', '22-Mar-2002 18:42:06'] ]
or set different background time
intervals for each channel using b0times, b1times (btimes takes priority
so disable btimes first):
IDL> a->set, btimes=0
IDL> a->set, b0times= [ ['22-Mar-2002 18:12:54', '22-Mar-2002 18:14:36'], $
    ['22-Mar-2002 18:40:57', '22-Mar-2002 18:42:06'] ]
IDL> a->set, b1times=  ['22-Mar-2002 18:14', '22-Mar-2002 18:15']
IDL> a->set,bfunc='exp' ;-- choices are 0poly,1poly,2poly,3poly, or exp
IDL> a->set, /bsub ;-- set bsub to 1
IDL> a->plot, /bk_overlay ;-- plot two channels and background for two channels
Any data you retrieve or plot after setting valid btimes intervals, and
setting bsub to 1, will have the background in each channel subtracted. To
stop subtracting background, set bsub to 0 or set btimes to 0.
IDL> a->set, bsub=0 ;-- don't subtract background
Even if you are working from the command line, you can use the PLOTMAN
interface to select background intervals graphically by typing:
IDL> a->select_background    ;-- use graphical interface for selecting background.
                             ;   Use /ch0 or /ch1 for selecting b0,b1times.
IDL> ptim, a->get(/btimes) ;-- display background time intervals in ASCII format.
You can also set the background level manually for either channel using
the b0user, b1user parameters. If either of these is set, it
overrides the background computed from the background time interval.
IDL> a->set, b0user = 1.4e-7  ;--  can be scalar or vector.  If vector, it's interpolated
                              ;    to the # data points in the selected time interval
IDL> temp = a->getdata(/temperature)
IDL> emis = a->getdata(/emission)
IDL> lrad = a->getdata(/lrad) ;-- get total radiative energy loss rate
IDL> lx = a->getdata(/lx) ;-- get X-ray energy loss rate
IDL> lrad = a->getdata(/lrad, /integrate) ;-- cumulative sum of lrad
IDL> a->set,abund='Coronal'                ;-- choose spectral model
                                           ;   choices are 'Coronal', 'Photospheric', 'Meyer'
IDL> a->set,itimes=['22-Mar-2002 18:16:18', '22-Mar-2002 18:30:57'] ;-- set time for lrad integration
To unset integration time, set itimes to [0.,0.] or -1.
Even if you are working from the command line, you can use the PLOTMAN
interface to select integration intervals graphically by typing:
IDL> a->select_integration_times ;-- use graphical interface for selecting integration times
IDL> ptim, a->get(/itimes) ;-- display integration time intervals in ASCII format
See below for how to retrieve all
quantities in a structure with one call.
IDL> a->plot, /temp ;-- (or could use plotman)
IDL> a->plotman, /emis ;-- (or could use plot)
IDL> a->plot, /lrad ;-- plots lrad and lx (total and X-ray energy loss rate)
IDL> a->plot, /lrad, /integrate ;-- plots integrated lrad and lx
More options for extracting GOES data arrays
Instead of calling getdata for each quantity you need, call getdata with the
/struct keyword to return a structure containing all of the available
quantities, as follows:
IDL> data = a->getdata(/struct) ;-- extract data and derived quantities into a structure
IDL> help, data, /struct
IDL> help,data,/st
** Structure <70774e0>, 15 tags, length=3936, data length=3928, refs=1:
UTBASE STRING '22-Mar-2002 18:00:00.000' ; utbase time
TARRAY LONG Array[61]         ; time array in seconds relative to utbase
YDATA FLOAT Array[61, 2]      ; 2 channels of GOES data in watts/m^2
YCLEAN FLOAT Array[61, 2]     ; 2 channels of cleaned GOES data in watts/m^2
YBSUB FLOAT Array[61, 2]      ; 2 channels of cleaned background-subtracted data in watts/m^2
BK FLOAT Array[61, 2]         ; 2 channels of computed background in watts/m^2
BAD0 INT -1                   ; indices for channel 0 array that were bad
BAD1 INT -1                   ; indices for channel 1 array that were bad
TEM DOUBLE Array[61]          ; temperature array in MK
EM DOUBLE Array[61]           ; emission measure array in cm^-3 * 10^49
LRAD DOUBLE Array[61]         ; total radiative energy loss rate (or integral) array in erg/s
LX FLOAT Array[61]            ; radiative energy loss rate in X-rays (or integral) array in erg/s
INTEGRATE_TIMES STRING Array[2]   ; integration time interval
YES_CLEAN INT 1               ; 0/1 means data wasn't / was cleaned
YES_BSUB INT 1                ; 0/1 means background wasn't / was subtracted
Note: if you use getdata(/struct, /integrate) then lrad and lx are the
cumulative integrals.
To show the GOES event list (as defined by NOAA) for the current time period
set in the goes object:
IDL> gev = a->get_gev(/show)
Or to specify times explicitly and retrieve a structure with
decoded class:
IDL> gev = a->get_gev('23-jul-2002', '23-jul-2002', /struct, /class_decode)
Options to the get_gev function are:
| struct |
If set, return a structure with event information,
instead of a string array |
| class_decode |
If set, converts class to number, e.g. 'C1.2' becomes
1.2e-6 |
| show |
If set, calls prstr. Can include other keywords
that will be passed to prstr, e.g.
/nomore - show list in IDL log, not in 'more'
window
file='xxx.txt' - sends the output to file xxx.txt |
Print individual parameters (see the list of GOES
parameters for the names of each object parameter), e.g.
IDL> print,a->get(/showclass)
or use the help method to show a summary of parameter settings:
IDL> a->help

GOES parameter values:
Last data interval read:
  1-Jun-2002 00:00:00.000 to 3-Jun-2002 00:00:00.000
Current TSTART / TEND:
  1-Jun-2002 00:00:00.000 to 3-Jun-2002 00:00:00.000
ARCHIVE: YOHKOH then SDAC
MODE: 0
DATA TYPE: GOES8 3 sec
NEED_UPDATE: 0
CLEAN: 1
MARKBAD: 1
SHOW CLASS: 1
SUBTRACT BACKGROUND: 1
BACKGROUND TIMES:
  1-Jun-2002 07:53:39.000 to 1-Jun-2002 08:34:36.000
BACKGROUND FUNCTION: 0poly
USER BACKGROUND:
  Channel 0 : None
  Channel 1 : None
INTEGRATION TIMES:
  None
ABUNDANCE: Coronal (5.1)
IDL> a->savefile, filename='goes.sav'       ;-- If you don't specify a filename, a dialog box
                                            ;   will pop up to let you navigate to a file.
This saves the raw, cleaned, and background-subtracted flux in the two GOES
channels, and time array, the temperature , emission measure and energy loss
rate, and more.
IDL> restore, 'goes.sav' ;-- Restore saved data
IDL> prstr, readme                          ;-- Print the readme variable to see a summary
                                            ;   of the saved variables
The following parameters can be set into the GOES object and will persist
until changed. You can set them via the set command, or by passing
them as keywords in calls to getdata or plot or plotman.
| tstart |
Start time. Default is start of the day two days
ago. (If seconds, use TAI, relative to 1958.)
Example: a->set, tstart='13-Nov-2005 12:33.12.123' |
| tend |
End time. Default is end of the day two days ago. (If
seconds, use TAI, relative to 1958.)
Example: a->set, tend='13-Nov-2005 16:12:34.567' |
| sat |
Satellite preference. Options are goes6, goes7,
goes8, goes9, goes10, goes12. If selected satellite isn't
available for selected time, returns data for the most recent
satellite that does contain the time. As of September 2015, the
options are:
goes91, goes92, goes1, goes2, goes3, goes5, goes6, goes7, goes8,
goes9, goes10, goes11, goes12, goes13, goes14, goes15
Example: a->set, sat='goes12' or a->set, /goes12 |
| sdac |
Selects XRS data archive to use, SDAC or YOHKOH.
Options are
0 - use YOHKOH
1 - use SDAC
2 - use YOHKOH, then SDAC (if not available in
YOHKOH, use SDAC)
3 - use SDAC, then YOHKOH
Default is 2.
Example: a->set, /sdac or a->set, sdac=0
(or a->set,/yohkoh) or a->set,sdac=3 |
| mode |
Data resolution. Options are 0,1,2 for 3-second,
1-minute, and 5-minute data. Can set via 0,1,2 or /three, /one,
/five. Default is 0. (Note: Only 3-second data is available in
the SDAC data archive.)
Example: a->set, /five or a->set, mode=2 |
|
euv |
Set to 1, 2, or 3 to select EUVA, EUVB, or EUVE data.
(sdac and mode parameters are not used). Set to 0 to use XRS data
(via sdac and mode). |
| clean |
If set, clean glitches from gain changes, etc in data.
Default is 1. (Note: Data from YOKHOH archive is already cleaned.)
Example: a->set, /clean |
| bsub |
If set (and btimes or b0user/b1user is set), subtract
background. Default is 0.
Example: a->set, /bsub |
| btimes |
Any number of background start/end times in [2,n]
array. Default is none. (If seconds, use TAI, relative
to 1958.)
Example: a->set, btimes= [ ['22-Mar-2002 18:12:54',
'22-Mar-2002 18:14:36'], $
['22-Mar-2002 18:40:57', '22-Mar-2002 18:42:06'] ] |
|
b0times |
Same as btimes, but for channel 0 background.
btimes takes priority if set. |
|
b1times |
Same as btimes, but for channel 1 background.
btimes takes priority if set. |
| bfunc |
Function to use for computing background. Options are
0poly, 1poly, 2poly, 3poly, exp. Default is 0poly.
Example: a->set, bfunc='exp' |
|
b0user |
User-defined background for channel 0. Scalar or
vector. Set to -1 to disable.
Example: a->set, b0user=4.e-7 |
|
b1user |
Same as b0user, but for channel 1 |
| showclass |
If set, show A,B,C,M,X level on side of plots.
Default is 1.
Example: a->set, showclass=0 |
| markbad |
If set, mark bad points (that are cleaned if clean is
set) with an X in plots. Default is 1.
Example: a->set, markbad=0 |
| abund |
Spectral model used in calculation of temperature and
emission measure. Options are 0/1/2 for Coronal, Photospheric,
Meyer. Default is 0.
Example: a->set, abund=1 or a->set,
abund='photospheric' |
| itimes |
A single time interval to define the integration
interval for energy loss calculation. Default is none, which means
integrate over the entire time interval. (If seconds, use TAI,
relative to 1958.) To unset integration time, set itimes to
[0.,0.] or -1.
Example: a->set,itimes=['22-Mar-2002 18:16:18',
'22-Mar-2002 18:30:57'] |
The following keyword parameters apply only to the getdata, plot, or
plotman methods, and do not persist, i.e. they apply to the current call
only.
| temperature |
If set, return or plot temperature.
Example: a->plot, /temperature |
| emission |
If set, return or plot emission measure .
Example: emis = a->getdata(/emis) |
| lrad |
If set, return or plot radiative energy loss rate
Example: a-> plotman, /lrad |
| integrate |
If set, and lrad is set, return or plot integrated
energy loss rate. Uses itimes for integration times. |
| structure |
Applies only to getdata call. If set, getdata
returns a structure with everything.
Example: struct = a->getdata(/struct) |
|
quick_struct |
Applies only to getdata call. If set, getdata returns
a structure with items specified by keyword arguments. Faster
than /struct if you don't need everything computed.
Example: struct = a->getdata(/quick_struct) |
Last Revised:
12/16/2019