1.1 Creating a Map
The low-level function for creating a map is
make_map.
In this example, a 256x256 array is created
with findgen and converted to a map variable:
The resulting map is an anonymous structure with the following
tag definitions:
IDL> image=findgen(256,256)
IDL> map=make_map(image)
IDL> help,/st,map

** Structure <4031f908>, 8 tags, length=40056, refs=1:
   DATA            FLOAT     Array[256,256]
   XC              FLOAT           0.00000
   YC              FLOAT           0.00000
   DX              FLOAT           1.00000
   DY              FLOAT           1.00000
   TIME            STRING    '11-Mar-1998 11:40:44.000'
- DATA: the 2-d data values.
- XC, YC: the cartesian coordinates
of center of the image.
Since coordinate information was not specified, the
origin is used as the default value.
- DX, DY: the spacing between between pixels in the
cartesian X and Y directions,
respectively. Since spatial scale was not specified, the spacings default to unity.
- TIME: a reference time for the image. It could be the start or mean time of the image. The default time is the current Universal Time (UT) when the map is created.
The above tag definitions are defined also as keywords in make_map.
For example, a map with a pixel spacing of 2 units in the x-direction and
3 units in the y-direction is created by:
IDL> image=findgen(256,256)
IDL> map=make_map(image,dx=2,dy=3)
IDL> help,/st,map
** Structure <403cd0e8>, 9 tags, length=40072, refs=1:
   DATA            FLOAT     Array[100, 100]
   XC              FLOAT           0.00000
   YC              FLOAT           0.00000
   DX              FLOAT           2.00000
   DY              FLOAT           3.00000
   TIME            STRING    '18-Mar-1998 15:23:16.000'
Note that the basic map structure definition is kept intentionally simple,
with data and coordinate parameters being the main defining properties.
The units of the coordinate system are also arbitrary.
Additional properties are added two ways:
- At the definition stage. For example,
to include a property UNITS that specifies coordinate units:
IDL> nmap=make_map(map,units='arcsecs')
IDL> help,nmap,/st
** Structure <403cd0e8>, 9 tags, length=40072, refs=1:
   DATA            FLOAT     Array[100, 100]
   XC              FLOAT           0.00000
   YC              FLOAT           0.00000
   DX              FLOAT           2.00000
   DY              FLOAT           3.00000
   TIME            STRING    '18-Mar-1998 15:23:16.000'
   UNITS           STRING    'arcsecs'
- After the definition stage. Following the same example, but
using the function
add_prop :
IDL> add_prop,map,units='arcsecs'
produces the same result. Multiple properties are added as multiple keywords, with the restriction that each property name is unique.
1.2 Plotting a Map
Maps are plotted using the procedure plot_map . Thus, using the 2-d image created earlier,
IDL> plot_map,map
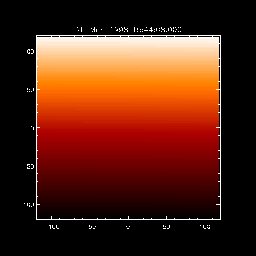
Fig. 1 - Image Map
The procedure plot_map inherits all the major IDL plot keywords such as xstyle, ystyle, font, charsize, charthick, etc. It supports the following additional keywords:
- drange: 2-element vector of data min and max to display
- xrange: 2-element vector of xmin and xmax to display
- yrange: 2-element vector of ymin and ymax to display
- /log: display using log10 scaling
- xsize, ysize: device pixel size for the plot window [def=512x512]
- /noaxes: inhibit plotting axes
- /nolabels: inhibit printing axis labels
- /notitle: inhibit printing title
- /cont: plot image as a contour
- levels: an array of contour levels
The use of more advanced keywords will be demonstrated
later in this tutorial.
The following steps demonstrate how to simultaneously plot maps using
different color tables.
The key to plotting with separate color tables is to divide
evenly the
total number of available device colors. The latter is given by
the system variable !d.table_size. In the above example, the
total available colors is 200. Hence, the color table is split into
two equal halves of nc=100 colors each. The routine
loadct loads a red color table (#3) into the first 0 to nc-1
color range, and blue color table (#1) into the second
nc to 2*nc-1 range. The resulting plots appear as:
The following examples demonstrate various image processing
that can be applied to maps.
Maps are rotated using the function rot_map
. An interesting example is provided by rotating (i.e, rolling)
a SOHO EIT full Sun image. The routines for creating
an EIT map will be described in
section 3.1 .
For now, assume
a 512x512 EIT map, eit_map with the following
properties:
This map contains an EIT 304 Angstrom image that has been double-binned
from its original 1024x1024 size. Note the additional properties
ID specifying the image wavelength,
DUR specifying the image duration, and SOHO
specifying image source.
To rotate this map through, say, 60 degrees
clockwise about its center, and display the results:
The keyword /new forces the creation of a new plot window in
which to plot the rotated image. The rotation is performed by rotating the
coordinates of each image pixel, computing a new grid of rotated coordinates,
and interpolating the new grid back to the original image. Generally, the
dimensions of the rotated grid will be larger than the original image. By
default, rot_map will preserve the original image dimensions by
clipping image pixels that fall outside the original dimensions. The keyword
/full_size inhibits clipping.
The roll angle and roll center are added as property fields name ROLL and
ROLL_CENTER to the rotated map. The roll angle in units of
degrees measured clockwise from North and the
roll center coordinates are in
data units (i.e., arcsecs).
Note that if the input map is already rolled, then the new roll angle
will be added to the existing roll value.
By default, the map is rotated about its center.
The keyword center can be used to rotate about an arbitrary center,
e.g., center=[20,30] .
The keyword roll has the same functionality and can be used
to roll a map to any given roll angle, regardless of its current
roll angle. For example, to rotate
a map to a 100 degree roll:
The function grid_map
changes the dimensions and pixel spacing of a map.
For example, the following command will rebin the 512x512 EIT map displayed in
figure 3a, to a 128x128 size map:
The (x,y) pixel spacings of the output map are computed automatically.
To change the spacing between pixels, use the keywords dx, dy .
For example,
to rebin to a pixel spacing of 2 units in x- and 5 in y-directions:
The (x,y) dimensions of the output map are computed automatically. Spacing and
output dimension parameters can be combined to produce different
stretching and resizing effects. For large images, regridding can be a slow
process since each pixel has to be interpolated onto a new spatial scale.
The procedure sub_map
extracts a sub-region from a map. It can be used in
two ways, graphically or manually.
A sub-region of map is selected graphically by using the keyword
/plot, in which case plot_map is called and a "rubber-band"
cursor is used to select a sub-region.
The sub-region map is returned in smap.
The data coordinate limits of the sub-region
are returned as two-element vectors
in the keywords xrange and yrange.
Alternatively, the data coordinate limits
can be input via the keywords
xrange=[xmin,xmax], yrange=[ymin,ymax], or
via the keyword ref_map. In the latter case, the
extracted sub-region will be extracted according to the xrange/yrange
values of ref_map.
The procedure diff_map
subtracts two maps to produce a difference map.
The output map dmap contains a difference
image of the two images contained in the map1 and map2
input maps -- the second image is subtracted from the
first. The optional keyword /rotate solar rotates the second image
to the time of the first image prior to subtraction. Solar rotation
is described in section 3.6 .
This section describes the steps involved in creating
maps for various solar datasets.
The routine
index2map is a generally useful program for
creating maps from any dataset
that is in a Yohkoh index/data format.
The following lines read and
process EIT images into maps:
Each step is summarized as follows:
In the case of full-disk images, the 1024x1024
array size can lead to IDL out-of-memory problems on some systems.
To avoid this problem, there is an optional outsize keyword to
rebin images to a smaller dimension (with accompanying
loss of spatial resolution). The following
example creates a 512x512 map.
The outsize keyword can also be used
when reading the image with read_eit.
More detailed documentation on manipulating EIT
data is located in the
EIT Users Guide .
The function
mk_cds_map creates CDS maps. The CDS instrument produces
images by rastering in pre-determined spectral lines. Images can be derived
by using the peak count rate intensity of these lines, or by integrating
the count rates over
the observed spectral wavelength band.
The following steps illustrate reading and
processing CDS images into maps:
Each step is summarized as follows:
Details on the use of rd_xda for reading SXT
files can be found in the Yohkoh Analysis
Guide. The procedure sxt_prep applies
instrumental corrections to the SXT raw image that include (among other things)
adjustment for spacecraft jitter, roll, dark current subtraction, and exposure
normalization. Multiple images can be combined with the restriction that they
have the same dimensions. Figure 4 shows a map created from an SXT
full-frame AlMg filter image with the following properties:
The above image is plotted using the keyword grid=20.
This keyword enables overlaying of a latitude and longitude grid with
a grid spacing equal to the keyword value in units of degrees.
Setting grid to a negative value will disable gridding, but
will enable plotting of the optical solar limb. The same effect
is achieved using the keyword /limb.
TRACE files are read and converted to maps as follows.
where the procedure
read_trace
is a special purpose reader for TRACE files.
FITS files can be converted to maps by using
the procedure
fits2map .
The following example reads and converts
a SOHO/MDI full-disk magnetogram FITS file into
a map, and plots the result:
The keyword header optionally returns the string header of
the FITS file.
The function
drot_map
rotates a map using the solar differential rotation
formula of Howard, Harvey, and Forgach, Solar Physics, 130, 295, 1990.
Since the formula is derived from statistical studies of small-scale magnetic
features, it is most accurately applied to photospheric
images and is less accurate when applied to transition region and
coronal images observed by EIT and SXT,
respectively. The following example demonstrates the differential
rotation of the above full-disk SXT image over 4 days.
Because solar rotation involves interpolating each pixel to a new
location, processing large 512x512 or 1024x1024 images can be very
time-consuming and memory-intensive on some systems. In the above example, the
SXT map is rebinned to a more manageable 256x256 size prior to
rotation. The function drot_map accepts map
and duration (in hours) as input arguments. It also supports the following keywords:
The function drot_map combines regridding, roll-correction, and
translation through the following additional keywords:
The fov keyword is a map structure from
which plot_map infers xrange and yrange values.
In the above example, only the sub-region of eit_map that
overlaps with that of sxt_map field-of-view is displayed.
This keyword is optional. Different sub-regions can be displayed also
via the xrange and yrange keywords.
The /rotate keyword corrects for solar rotation
of the overlayed image relative to the first. This correction
is important if the time difference between images is more
than several hours. The overlayed image can be rotated to a
specified time via the keyword time.
The following example shows an overlay of MDI
magnetogram contours on an SXT observation of flare loops.
The example illustrates the use of additional keyword options in
plot_map.
Each step is explained below:
The final example shows an overlay of a CDS Ne VI map
on an EIT 171 map, for a limb active region.
The keyword cthick=2 specifies a double thickness contour for the
overlay image.
1.3 Plotting Maps on Different Color Scales
IDL> image=findgen(256,256)
IDL> map=make_map(image)                ;-- make a simple map
IDL> nc=100                             ;-- # of colors per image
IDL> loadct,3,ncolors=nc                ;-- load red table from  0:nc-1
IDL> plot_map,map,ncolors=nc            ;-- plot map using red table
IDL> loadct,1,bottom=nc,ncolors=nc      ;-- load blue table from nc:2*nc-1
IDL> plot_map,map,bottom=nc,ncolors=nc  ;-- plot using blue table

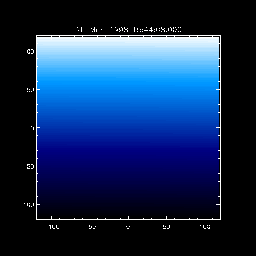
Fig. 2a - Red Table
Fig. 2b - Blue Table
2. OPERATIONS WITH MAPS
2.1 Rotating a Map
   DATA            INT       Array[512, 512]
   XC              FLOAT           14.2450
   YC              FLOAT          -13.0278
   DX              FLOAT           5.18000
   DY              FLOAT           5.18000
   TIME            STRING    '15-Mar-1998 00:00:49.985'
   DUR             FLOAT           12.1000
   ID              STRING    'EIT: 304'
   SOHO            INT              1
   UNITS           STRING    'arcsecs'
IDL> rmap=rot_map(eit_map,60.)
IDL> plot_map,eit_map,/log
IDL> plot_map,rmap,/log,/new

IDL> help,/st,rmap

   DATA            INT       Array[512, 512]
   XC              FLOAT           14.2450
   YC              FLOAT          -13.0278
   DX              FLOAT           5.18000
   DY              FLOAT           5.18000
   TIME            STRING    '15-Mar-1998 00:00:49.985'
   DUR             FLOAT           12.1000
   ROLL            FLOAT           60.0000
   ROLL_CENTER     FLOAT     Array[2]
   ID              STRING    'EIT: 304'
   SOHO            INT              1
   UNITS           STRING    'arcsecs'
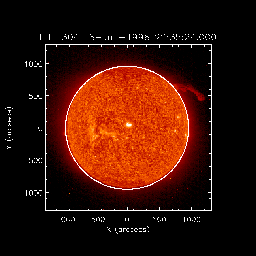
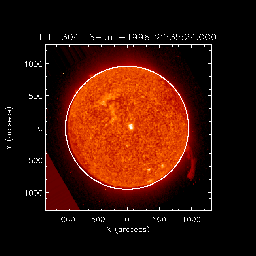
Fig. 3a - Before roll
Fig. 3b - After roll
IDL> rmap=rot_map(eit_map,roll=100.)
2.2 Stretching and Resizing a Map
IDL> gmap=grid_map(map,128,128)
IDL> gmap=grid_map(map,dx=2,dy=5)
2.3 Extracting a Sub-Region From a Map
IDL> sub_map,map,smap,/plot,[xrange=xrange,yrange=yrange,ref_map=ref_map]
2.4 Differencing Maps
IDL> dmap=diff_map(map1,map2,[/rotate])
3. APPLYING MAPS TO SOLAR IMAGES
3.1 Creating a SOHO/EIT Map
IDL> files=eit_files('19-mar-98','20-mar-98',wave=304,/full)
IDL> read_eit,files,index,data,[outsize=outsize]
IDL> eit_prep,index,data=data,outindex,outdata
IDL> index2map,outindex,outdata,emap
IDL>index2map,outindex,outdata,emap,outsize=512
3.2 Creating a SOHO/CDS Map
IDL> files=cds_files('19-mar-98','20-mar-98',study=study,info=info)
IDL> read_cds,files,ql
IDL> cds_map=mk_cds_map(ql,window,/calib,/clean)
3.3 Creating a Yohkoh/SXT Map
The following example, reads and creates an SXT map
from an SXT full-frame data file:
IDL> rd_xda,'sfr970407.1229',-1,index,data
IDL> sxt_prep,index,data,outindex,outdata,/register,/norm,/roll
IDL> index2map,outindex,outdata,sxt_map
IDL> help,/st,sxt_map
** Structure <40a74fe8>, 9 tags, length=1048648, refs=2:
   DATA            FLOAT     Array[512, 512]
   XC              FLOAT          -73.8006
   YC              FLOAT          -154.193
   DX              FLOAT           4.91000
   DY              FLOAT           4.91000
   TIME            STRING    ' 6-Jun-1996 19:30:37.000'
   DUR             FLOAT           1.00000
   ID              STRING    'AlMg '
   UNITS           STRING    'arcsecs'

IDL> plot_map,sxt_map,/log,grid=20
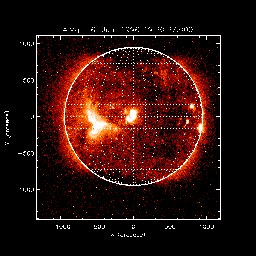
Fig. 4 - SXT map
3.4 Converting a TRACE File to a Map
IDL> read_trace,file_name,dset,index,data
IDL> index2map,index,data,trace_map
IDL> plot_map,trace_map
3.5 Converting a FITS File to a Map
IDL> fits2map,'smdi_maglc_fd_19980331_1117.fts',map,header=header
IDL> loadct,0
IDL> plot_map,map
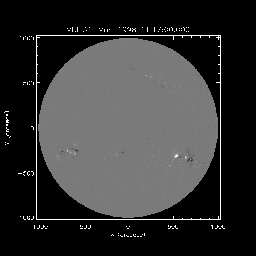
Fig. 5 - MDI map
3.5.1 Converting a RHESSI FITS File to a Map
RHESSI FITS files are converted to maps by using
fits2map. RHESSI images can be created using the RHESSI
GUI and saved as FITS files
3.6 Correcting for Solar Differential Rotation
IDL> gmap=grid_map(sxt_map,256,256)
IDL> dmap=drot_map(gmap,4,/days)
IDL> plot_map,sxt_map,/log
IDL> plot_map,dmap,/log,/new,/limb
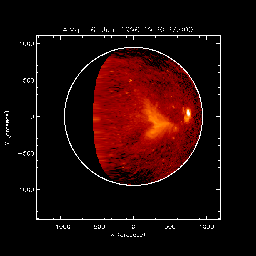
Fig. 6 - Rotated SXT map
4. OVERLAYING MAPS
Maps are graphically overlayed using the keyword /over
in plot_map . In the following example, an
SXT map is contoured over an EIT map.
IDL>plot_map,eit_map,fov=sxt_map,/log  ;-- first plot EIT
IDL>plot_map,sxt_map,/log,/over,/rotate  ;-- then contour over SXT
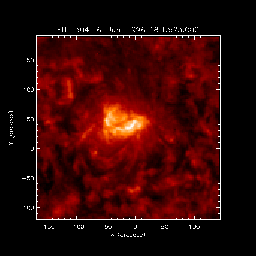
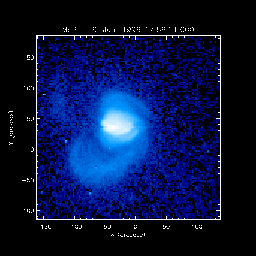
Fig. 7a - EIT
Fig. 7b - SXT
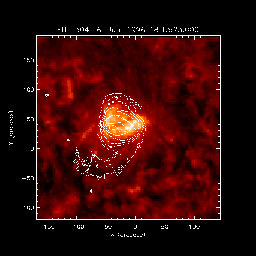
Fig. 7c - SXT/EIT Overlay
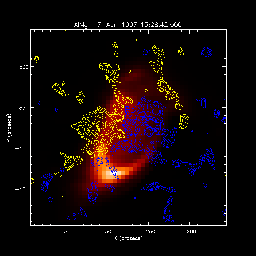
Fig. 8 - MDI/SXT Overlay
IDL>set_line_color
IDL>levels=100+findgen(11)*100.
IDL>plot_map,sxt_map,/log,bottom=11
IDL>plot_map,mdi_map,/over,/rotate,/positive,c_color=5,levels=levels
IDL>plot_map,mdi_map,/over,/rotate,/negative,c_color=2,levels=-levels
IDL>plot_map,eit_map,/log
IDL>plot_map,cds_map,/over,cthick=2
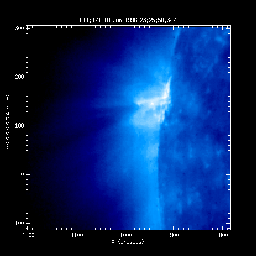
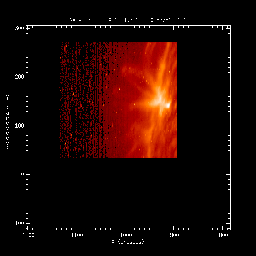
Fig. 9a - EIT 171
Fig. 9b - CDS Ne VI
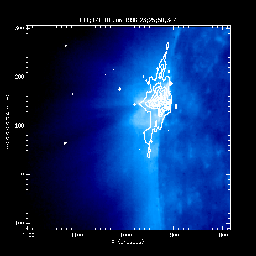
Fig. 9c - CDS/EIT Overlay
Last Revised: