 |  |  |
 |  |  |
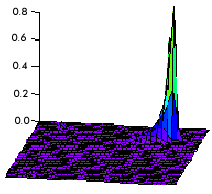 | 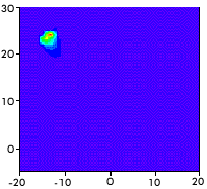 |
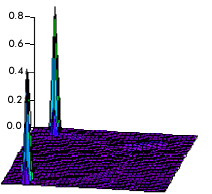
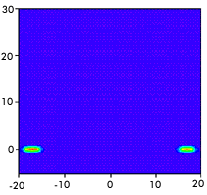
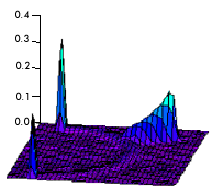
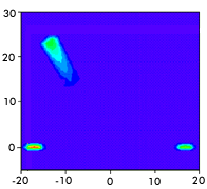
The figures in the table below demonstrate how changing the plasma density in the model loop affects its appearance. As on the previous page, both surface and color contour plots are shown. All images are for 30 keV x-rays. The three rows of the table show the emission when the plasma density is an order of magnitude less than, equal to, and an order of magnitude greater than 2 x 1011 cm-3.
| | |
| | |
| |
The footpoints clearly dominate the emission at the lower density, and the cusp dominates at the higher density. At 2 x 1010 cm-3 the density in the loop is not high enough for significant bremsstrahlung to be produced and the electrons do not lose much energy in the loop. Therefore, most of the bremsstrahlung x-rays are emitted from the high-density footpoints. When the density in the loop is as high as 2 x 1012 cm-3, most of the electrons lose their energy in the cusp and, therefore, only the cusp is bright. At 2 x 1011 cm-3 the density is high enough for significant bremsstrahlung to be produced in the cusp by the relatively large number of electrons with energies not much greater than 30 keV. These electrons lose most of their energy in the cusp. Enough of the higher energy electrons make it to the footpoints to produce significant bremsstrahlung there as well.
![]() View a video animation showing how the appearance of the loop at 30
keV changes as the plasma density increases from 1 x 109 cm-3 to 5 x
1012 cm-3. The video is available in AVI format (745 K) and MPEG
format (115 K).
View a video animation showing how the appearance of the loop at 30
keV changes as the plasma density increases from 1 x 109 cm-3 to 5 x
1012 cm-3. The video is available in AVI format (745 K) and MPEG
format (115 K).
![]()