Click here to see the entire HESSI GUI Guide
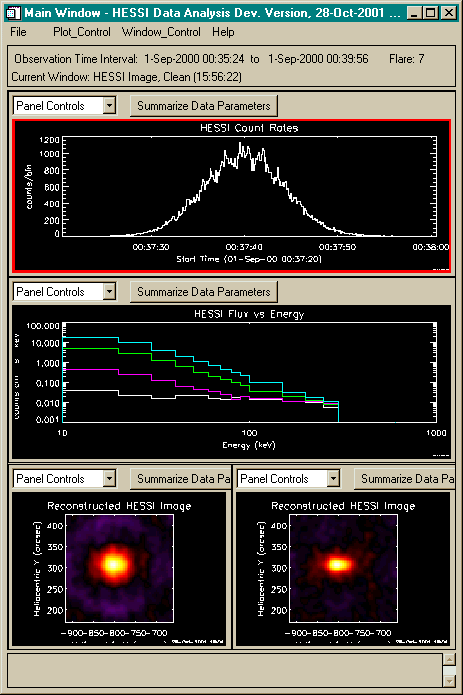
This is a snapshot of the GUI widget displaying 4 plots. The top panel shows the lightcurve for simulated Flare 7. The second panel shows the spectrum for Flare 7 over 4 5-second time intervals, with white, purple, green, cyan showing the progression from the start to the peak of the flare. The images are both over 4 seconds at the peak of the flare and are shown using the HESSI color table; the one on the left was reconstructed using the Back Projection method and the one on the right used the Clean algorithm. After constructing each of these plots independently, the Configure button under the Window_Control Pull-down menu was used to plot all four in the same window.
Last updated 29 October, 2001 by Kim Tolbert, 301-286-3965