Click here to see the entire HESSI GUI Guide
| Snapshots |
| Snapshot of the Widget |
| Snapshot of the Animator |
The HESSI Image Movie Widget is a tool that shows movies of the data contained in a HESSI image cube FITS file.
A HESSI image cube FITS file is created in the GUI when you select multiple time and/or energy intervals in the HESSI Image Widget and then click 'Make Movie File'. The FITS file contains an image created at each energy and time interval you selected, while all other image reconstruction parameters remain constant.
This widget is activated when you click File / 'View Image Movie' in the Main
GUI Window. It can also be run standalone by typing
hsi_image_movie
at the
SSWIDL command line.
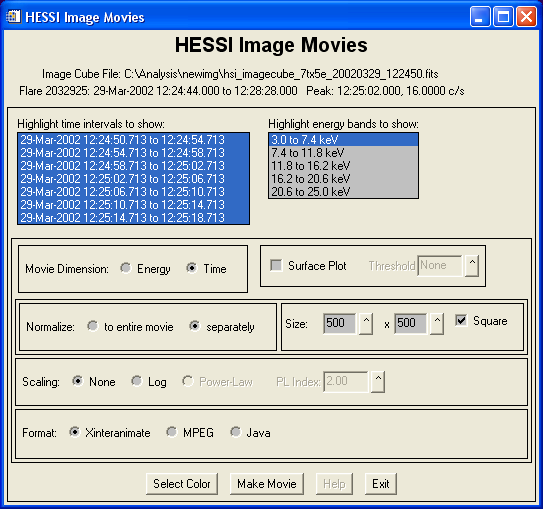
When you start the HESSI Image Movie Widget, it first asks you to select an image cube FITS file. A dialog box appears to let you navigate to the correct directory and select a file. Once you've selected a FITS file, the Movie Widget appears.
Click here to see a picture of the HESSI Image Movie Widget. Near the top of the widget, the FITS file name you chose is displayed. If the file contains a HESSI flare, the next line displays the flare number, the start, peak, and end times of the flare, and the total counts for the flare. All of the image cube time intervals and energy intervals available from the FITS file are displayed in the time and energy band lists. If you simply click 'Show Movie' now, you will see a movie showing all of the time intervals at the lowest energy band. To see other types of movies, change the parameters as described below.
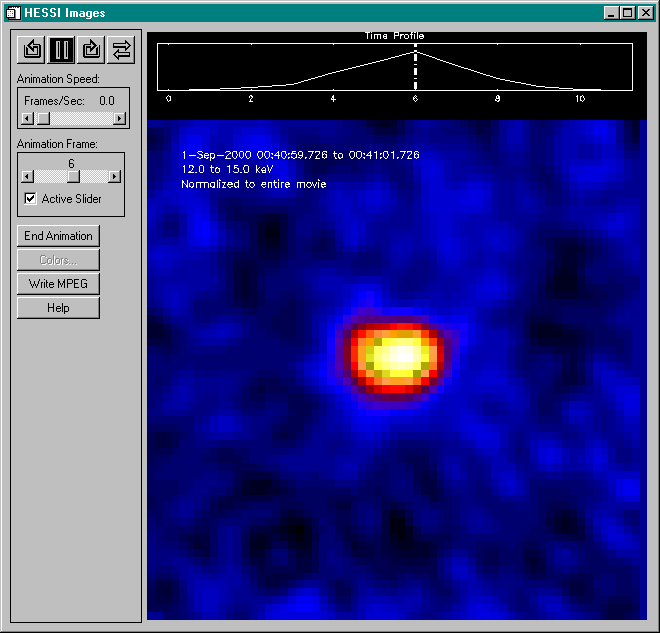
Once you have clicked 'Show Movie', a series of frames is constructed based on your choices. These frames are displayed in an IDL animator. Click here to see a picture of the animator. After the frames have finished loading into the animator, you can click buttons to stop and start the animation, change the speed, show it in the reverse or forward direction, or click through one frame at a time. However, in order to change any of the movie options discussed below, you must exit the animator by clicking 'End Animation', make your changes, and then create a new movie.
Note that if the movie options you select result in a movie with only one frame, then the animator is not called and the single frame is shown in a simple IDL plot window.
There are a number of options for viewing the images in the image cube FITS file. Select among the options described below, and then click 'Show Movie' to construct the movie and pass it into the animator.
| Widget Option | Description |
| Choose Time Intervals | Choose one or more time intervals from the list. The number of intervals allowed depends on your choices for movie options. Press shift while left-clicking to select a range; press control while left-clicking to add to your selection. |
| Choose Energy Bands | Choose one or more energy bands from the list. The number of bands allowed depends on your choices for movie options. Press shift while left-clicking to select a range; press control while left-clicking to add to your selection. |
| Movie Dimension | Choose whether to loop through time or energy for movie. |
| Surface Plot | If enabled, movie is shown as a surface plot. Otherwise, as a flat image. |
| Show Time Profile | If enabled, a very crude time profile is constructed from the time sequence of images, and shown at the top of the movie (see notes). A vertical bar on the time profile indicates the time of the image shown in each movie frame. If you enable this option but don't see the time profile plot, it may be that you have selected a color table with black at the top of the color range. Choose another color table. |
| Threshold | Threshold has
the following meaning depending on what you are showing in the movie:
Currently the best way to determine a reasonable value for the threshold is by making a surface plot of the images and noting the Z values. |
| Normalize each Frame | The default is to normalize each frame to the entire movie, which means that the full range of colors (or shades) is scaled to the minimum and maximum of the entire movie, and stays fixed for each frame. You can also choose to scale the colors for each frame to the minimum and maximum of that frame. |
| Show | There are several choices for what to show in the movie.
Some of the choices also allow you to choose whether to use the time or
energy dimension for the operation.
If invert is enabled, then the sense of the ratio, difference, or color-coding is inverted (i.e. instead of energy band 1 / energy band 2, we use energy band 2 / energy band 1). |
| Scaling | Three choices for scaling of each image are available:
|
| Image Size | X and Y pixel size of movie. Size does not include the time profile plot. |
| Select Color | Choose the color table for the movie from the 40 standard IDL colors. Has no effect if Color-coded representation is selected. |
| Summarize Image Parameters | Lists all image reconstruction parameters used for images in movie (with first time and energy interval). |
Notes:
1. The crude time profile is constructed as follows:
First any image whose kurtosis is less than 1/10 of the total kurtosis of all the images is eliminated. Then using the remaining images, for each time interval the total of the images over all of the energy bands is computed (but excluding any elements in the image that are less than twice the absolute value of the minimum value of the image). This time profile is only intended to give you an idea of where a movie frame falls in the progression of a flare, nothing more.
2. A fuller explanation of the color-code representation follows:
The color-code representation is an attempt to represent differences between images through the use of colors. For example if you use color-coding for two energy bands, 3-6 keV and 6-9 keV, then images that show more red would have more photons in the 3-6 keV range, and those with more green would have more photons in the 6-9 keV range. If you looked at this type of plot for a number of times intervals, you could see the evolution of the energy spectrum.
The color-coding is done using the IDL routine color_quan. In the case where we have two images, using red and green, the code instructs color_quan to interpret the first image as byte-scaled values showing the changes in the red dimension, and the second image as byte-scaled values showing the changes in the green dimension. Color-quan quantizes these images and constructs a color table to allow us to show both the red and the green dimensions combined in one color table. The color table is a strange one - if you click the 'Select Color' button after making a color-coded movie you will see it. (The color table reverts back to the one you selected if you make a non-color-coded movie.)
With color-code surface plots, the colors are computed the same wayas described above. (Usually the color of the surface indicates the height of the surface.) However you may notice unexpected colors in some regions of the surface plot. This is due to the fact that surface plots interpolate colors, and since the color table is an unusual one with 6 regions of color stripes, (you can see what the color table looks like as mentioned above), interpolations on those colors produce these interesting effects. I think the colors in between the bright colors show the correct color, but perhaps these plots are worthless.
Last updated 28 October, 2001 by Kim Tolbert , 301-286-3965