Time profiles of the RHESSI Observing Summary Count Rate data are available
online as .png files for every orbit (~1.5 hours) of the RHESSI mission.
They can be viewed through a
browser
tool or by browsing the RHESSI data archive tree
directly.
If you browse the tree directly, note that the files are stored in directories
under /hessidata/metadata/ named according to the year / month / day of the
data; the file name indicates the start time of the plot.
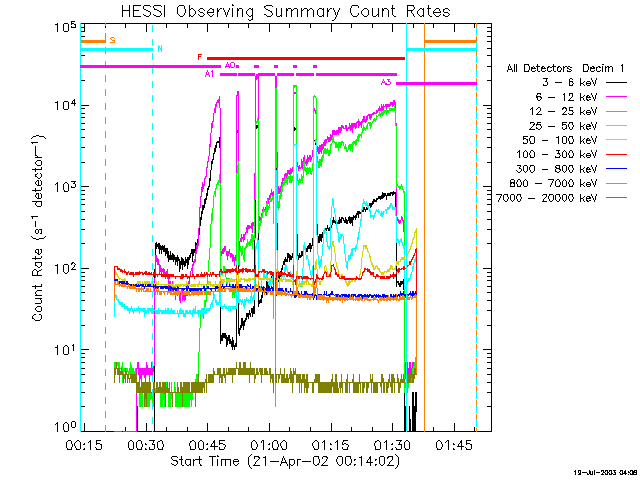
The observing summary data are spin-averaged, 4-second resolution count rates averaged over all nine detectors. They are shown in nine standard energy bands covering the range 3 to 20000 keV. Each orbit plot starts in the middle of orbit night and ends in the middle of the following night, so that the daytime portion is always centered in the plot.
For each orbit there are two plots, one showing the measured observing summary count rates, and the other showing 'Corrected' count rates. The corrections attempt to remove the effects of attenuator and decimation state changes. The plots are not corrected for dead time and pulse pileup effects. Note that the corrections are approximate, and should not be used in any quantitative analysis.
For example, shown below is the uncorrected plot for the X1.8 flare of April 21, 2002 00:40 UT, followed by the 'corrected' plot. In the uncorrected plot, you see the large steps in the count rate as the shutters moved in and out of the detector fields of view. The 'corrected' plot is normalized to the A1 state.
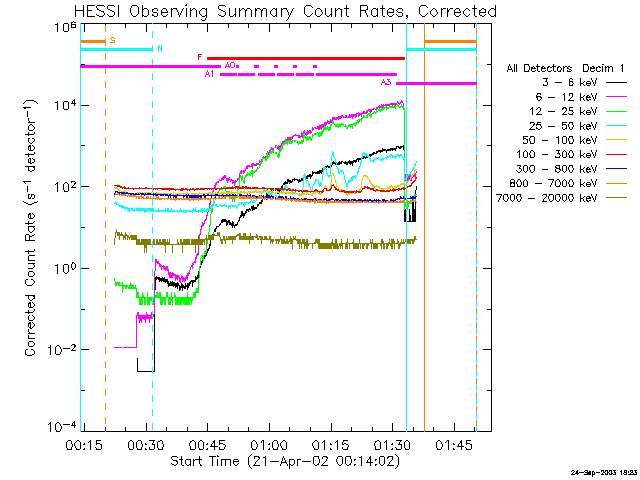
The colored bars along the top of the plots indicate different orbit or instrument states using the codes in the following table. If a non-default state exists for the entire orbit, it is indicated in the text above the energy channel legend. In the plots above, the front decimation level was 1 for the entire orbit.
| CODE | COLOR | LABEL | DESCRIPTION |
| N | cyan | Night | Sun is occulted by the Earth |
| S | orange | SAA | South Atlantic Anomaly passage, detectors are turned off |
| F | red | Flare | Solar Flare detected |
| +Dn or FDn | olive | Front Decimation Level | Every nth count in front detectors is saved. |
| RDn | dark green | Rear Decimation Level | Every nth count in rear detectors is saved. |
| An | pink | Attenuator State | 0=no attenuators 1=Thin in, thick out 2=thick in, thin out 3=both in |
| *FEn | blue | Front Decimation Energy | Front decimation only affects counts below energy n |
| *REn | purple | Rear Decimation Energy | Front decimation only affects counts below energy n |
| *R | green | Front Detectors Off | Only Rear detectors on |
+ earlier versions of the plots use Dn,
later versions use FDn (to differentiate from Front from Rear)
* these flags are not shown on the standard orbit plots, but are
available when you create plots interactively .
Using IDL, you can interactively generate plots similar to these orbit plots for any time interval through the RHESSI GUI under the File / Retrieve/Process Data / Observing Summary Data button, or from the command line.
For help in interpreting the variations in count rates in RHESSI light curves, see the Artifacts in RHESSI Light Curves document.
Last updated 03 January, 2011 by Kim Tolbert, 301-286-3965