 |  |  |
 |  |  |
 |  |  |
Computed images of the bremsstrahlung x-rays from our model loop are presented here. The x-rays are emitted by the steady-state distribution of energetic electrons within the loop. This steady state results from the balance between the constant injection of new electrons at the top of the cusp and collisional losses within the loop. Thermal bremsstrahlung from the 20 million degree plasma in the loop is also included. The plasma density in the loop is taken to be 2 x 1011 cm-3. This is 1000 times higher than the density of the injected nonthermal electrons.
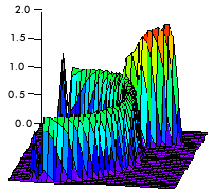
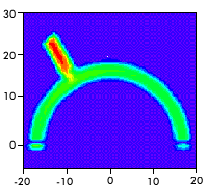
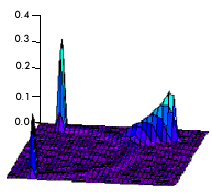
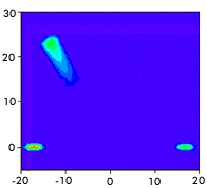
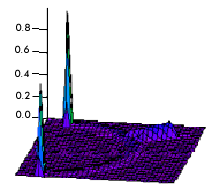
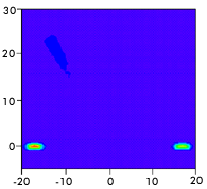
The figures in the table below show the computed structure of the model loop in hard x-rays at 14 keV, 30 keV, and 50 keV. These energies fall within each of the three Yohkoh Hard X-ray Telescope energy bands in which the limb flare was imaged. The computed images are shown as both a surface plot (middle column) and a color contour plot (last column). The contour plot is normalized to the peak intensity so that the highest intensity regions are red and low intensity regions are blue. The numbers on the axes of the contour plots mark the relative location of the x-ray emission in seconds of arc. The resolution of the images is 1 arc second.
[ A NOTE for the CONNOISSEUR:
The intensity of the computed x-ray emission, shown on the vertical axis of the
surface plots, is in units of photons cm-2 s-1 keV-1 arcsec-2. That is, we have
computed the number of x-ray photons within a 1 keV range of energies that
originate from a one arc second square area on the Sun that will impinge upon
each square centimeter of a detector at the Earth each second. ]
| | |
| | |
| | |
The images at 30 keV and 50 keV show that the footpoint and cusp structure observed by Yohkoh is obtained. The cusp becomes dimmer relative to the footpoints at higher energies. The left footpoint is somewhat brighter than the right footpoint. This is because the left footpoint is closer to the injection point than the right footpoint. The electrons streaming to the left footpoint experience less energy losses than those that travel the longer distance to the right footpoint.
Why is just the cusp bright? Why not the entire loop? For this choice of plasma density in the loop, the injected electrons with the lowest energies, those with energies around 30 keV, lose most of their energy in the cusp. Since there are many more low energy electrons than high energy electrons, a substantial portion of the x-ray emitting electrons are lost in the cusp. The remaining electrons are not numerous enough to produce bright emission in the remainder of the loop until they reach the dense footpoints, where they all radiate and lose their remaining energy in a very short distance. A low level of radiation from the semi-circular loop is visible in the 30 and 50 keV surface plots.
The bremsstrahlung from the thermal plasma is negligible at 30 and 50 keV, but brightens the entire loop at 14 keV. Radiation from the nonthermal electrons is still significant at the footpoints and from the cusp. The overall brightness of the loop and footpoints is consistent with the Yohkoh observations. The brightest location in the Yohkoh image is near the top of the loop, but the Yohkoh image does not show the bright cusp emission obtained from the model. A more detailed analysis is required to determined whether the model can be reconciled with the Yohkoh data in this energy band.
![]() View a video animation showing how the appearance of the model loop
changes as the energy of the x-rays increases from 12 keV to 40 keV. The
frame at 12 keV demonstrates how dominant the bremsstrahlung from the
thermal plasma becomes at low x-ray energies. The video is available in AVI
(460 K) and MPEG (240 K) formats.
View a video animation showing how the appearance of the model loop
changes as the energy of the x-rays increases from 12 keV to 40 keV. The
frame at 12 keV demonstrates how dominant the bremsstrahlung from the
thermal plasma becomes at low x-ray energies. The video is available in AVI
(460 K) and MPEG (240 K) formats.
On the next web page we show how the appearance of the model loop changes when we change the plasma density in the loop. In subsequent pages we look at the spectrum of the x-ray emission from the cusp and footpoints, the effect of energy losses on the injected electrons, and what happens to the energy lost by these electrons.
![]()
![]() Next: Changing the Plasma Density
Next: Changing the Plasma Density
![]() Back: The Injected Electrons
Back: The Injected Electrons
![]() Solar Flare Homepage
Solar Flare Homepage
![]() Table of Contents
Table of Contents