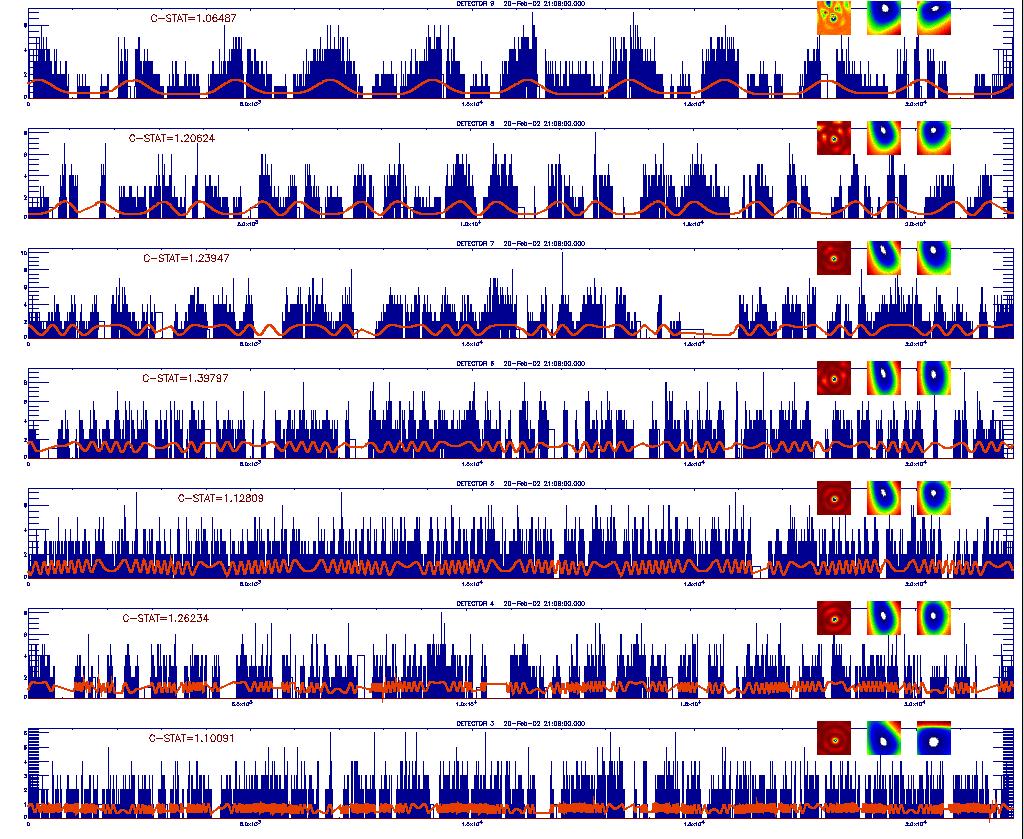
The model countrates (shown in red) and the observed countrates are shown below. (countrates in ms-1)
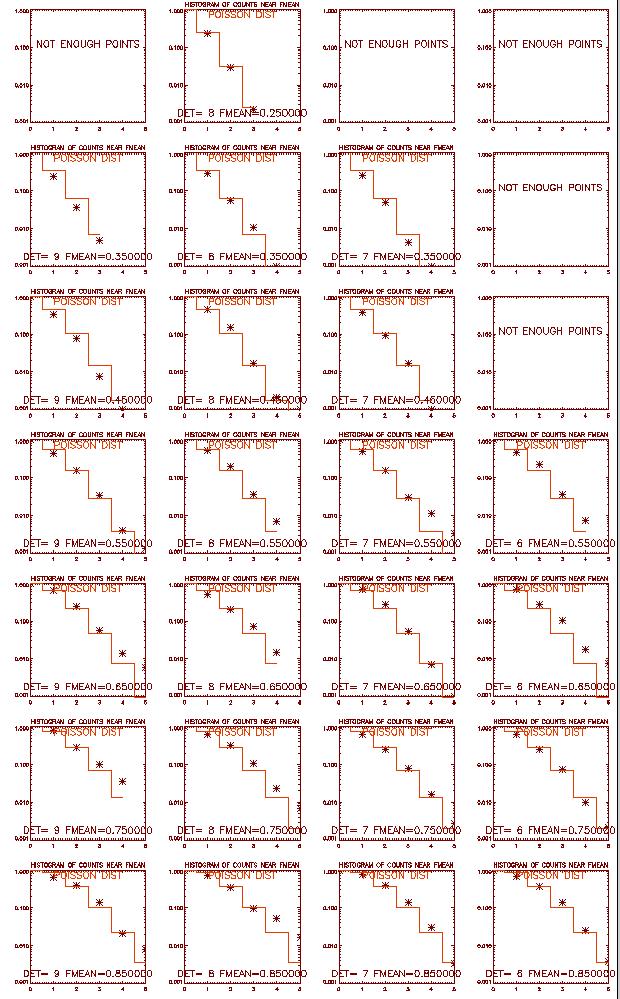
For detectors 6-9 and countrates 0.25-0.85 ms-1, the histograms are shown below. The predicted Poisson distribution with mean equal to the model mean FMEAN is shown in red. The histograms are normalized to unity at countrates of 0.
For detectors 3-6 and countrates of 0.25-0.85 ms-1, the histograms are shown below. The predicted Poisson distribution with mean equal to the model mean FMEAN is shown in red.
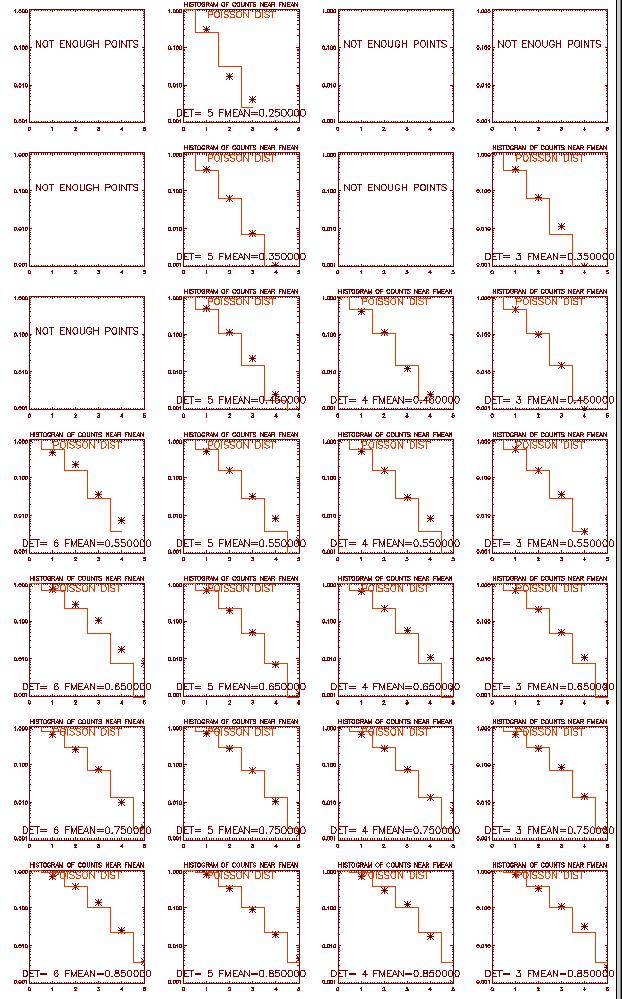
The good agreement between the predicted Poisson distributions and
the histograms of observed counts indicates that
(a) the model is a good fit and
(b) the countrates are Poisson distributed.
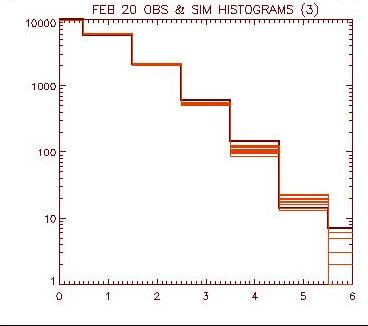
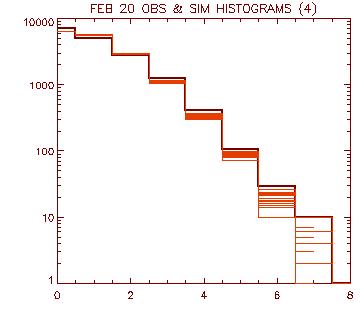
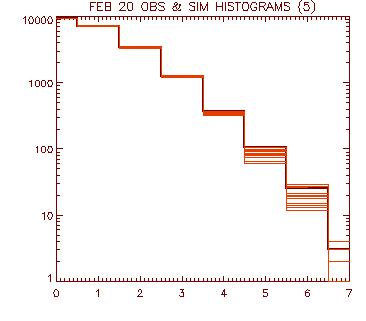
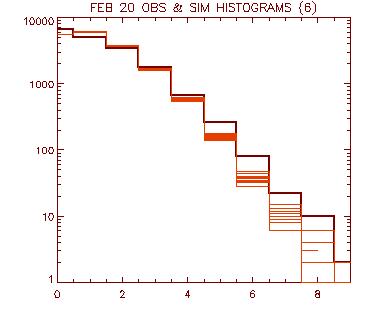
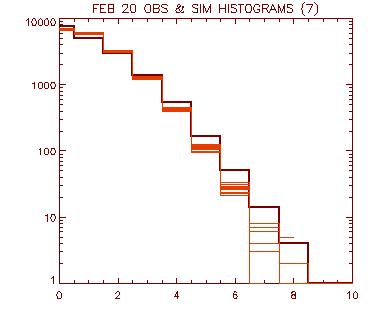
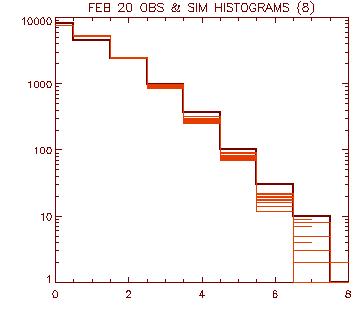
Additional tests were made by computing a simulated Poisson-distributed time series using the model countrates. This was done 15 times for each detector (3-9), so that the range of scatter could be seen in histograms. The seven plots below show histograms of the observed and simulated count rates with integer counts of 0 to 8.
 |  |
 |  |
 |  |
 |
Numerical experiments with the use of higher harmonics seem to give very nearly the same chisquare values for the fits, and the same results for the histograms described above.