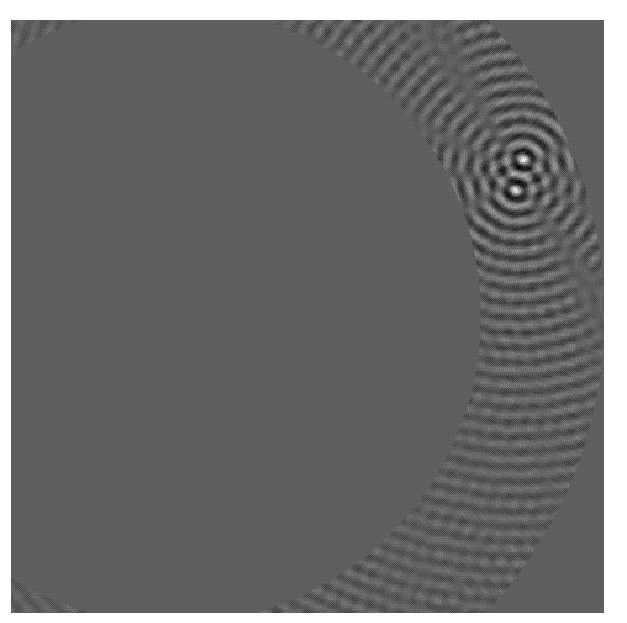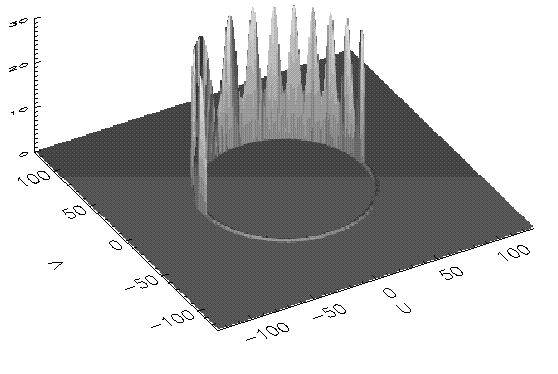
Fig. 1a: Modulation Profile on UV Circle

Before one can convert the (real) modulation profile into (complex) visibilities, it is necessary to find the phase center about which the map will be constructed. This can be done in several fundamentally equivalent ways:
Fig. 1b: Search for Optimum Regulation
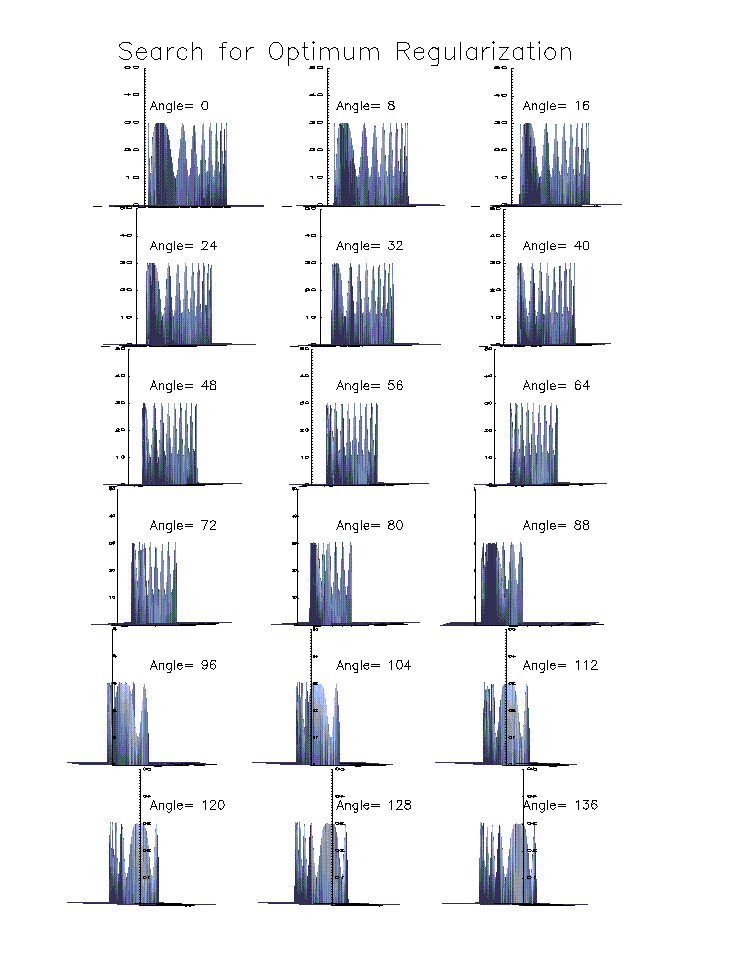
Once we have found the phase center, one may regularize the modulation profile and fit sinusoids to each of the modulation cycles. The amplitudes and phases of these sinusoids, when pieced together, provide the visibilities of the source. Alternatively, one may fit the profile with functions of the form cos(A*cos(B*t)+C), which are the "basis functions" for point source time series. (This has the advantage that the time intervals around the times of slowest modulation, where sinusoids of time t do not need to be treated separately.) This entire procedure makes the crucial assumption that the amplitudes do not vary significantly during one modulation cycle. (Of course, if the source changes on time scales much less than 2 s, the entire imaging process has to be revised.)
Fig. 1c: Modulation Profile plus Basis-Function Amplitudes
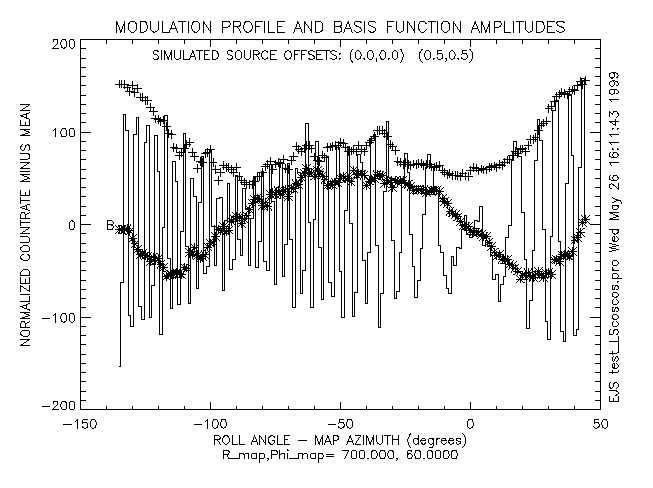
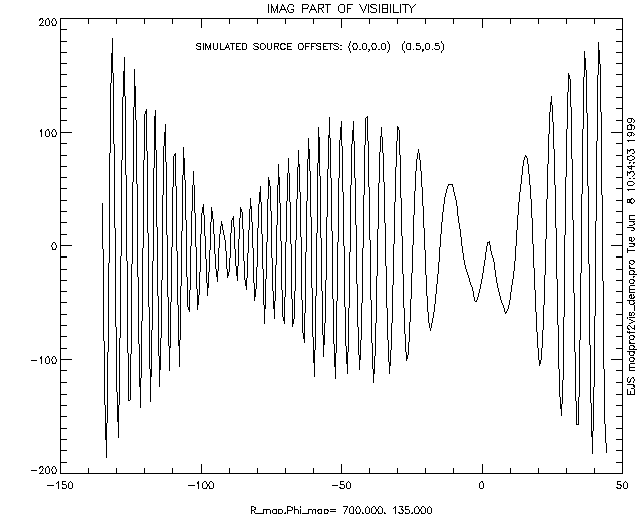
Piecing the basis-functions together provides the visibilities, as shown in the following figures. The dots on the real plot are the original modulation profile values.
Fig. 1d: Real Part of Visibility
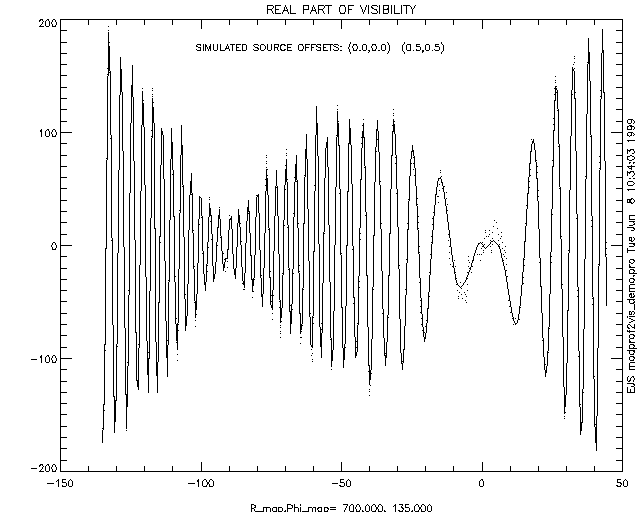 Fig. 1e: Imaginary Part of Visibility
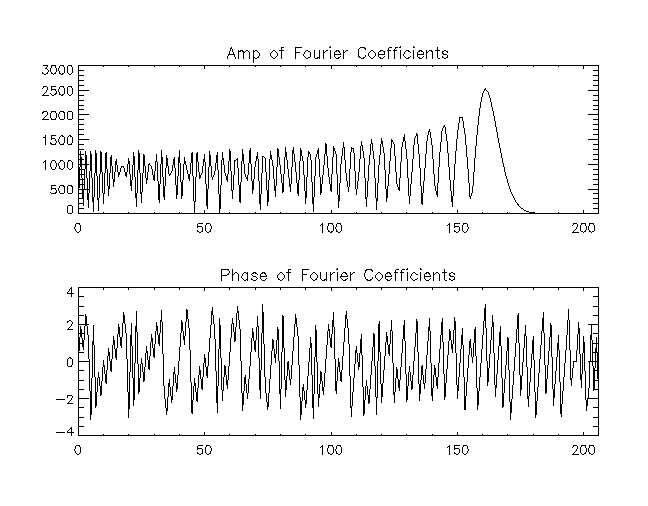
As indicated in the recipe for polar mapping (.gif, .ps), the polar map of the visibilities requires an initial Fourier transform (one-dimensional!) of the visibilities, and these are shown in the following figure.
Fig. 2: Amp and Phase of Fourier Coefficients
Then one multiplies the above transform by each column of a array of Bessel functions:
And the resulting product is a transform of the polar map:
Each column of the above array must be back-transformed to obtain the polar map. This is a about factor of 2 faster than a full 2-D transform, but what makes the method fast is the fact that the width of the above arrays is only the final map width, and not the 2048 required by sampling for rectangular representations. Finally, we get the polar map, where the figure has radius on the horizontal axis and azimuth along the vertical axis:
The polar map can then be projected onto rectangular coordinates:
Fig. 6: Polar Map Projected on X-Y Plane
