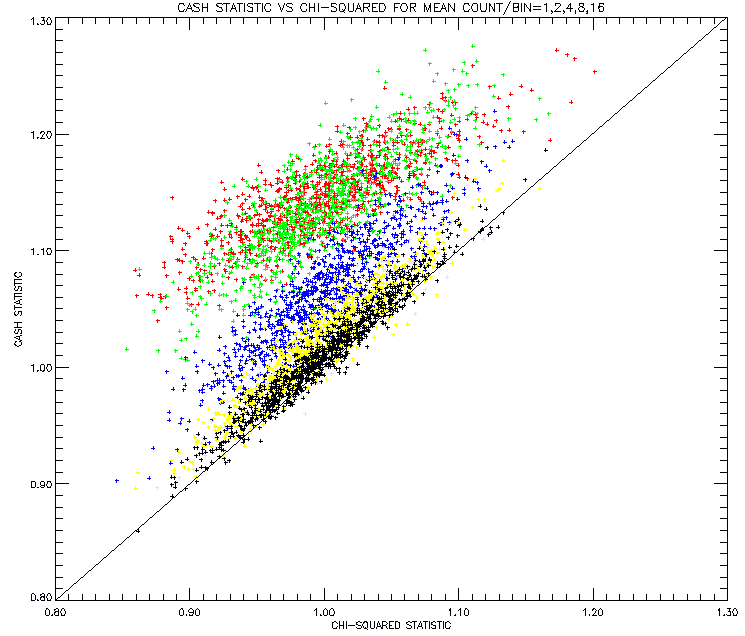
 versus the Chi-Square Statistic for counts/bin
equal to 1 (red) ,
2 (green) ,
4 (blue) ,
8 (yellow) ,
and
16 (black) .
versus the Chi-Square Statistic for counts/bin
equal to 1 (red) ,
2 (green) ,
4 (blue) ,
8 (yellow) ,
and
16 (black) .(These were created by using 10,000 Poisson-distributed pseudo-random numbers with means of 1,2,4,8, and 16.)
 versus the Chi-Square Statistic for counts/bin
equal to 1 (red) ,
2 (green) ,
4 (blue) ,
8 (yellow) ,
and
16 (black) .
(These were created by using 10,000 Poisson-distributed pseudo-random
numbers with means of 1,2,4,8, and 16.)
The first thing to note is that the Chi-Square Statistic is always scattered about 1.0, but the Cash Statistic can be as large as 1.2 for counts/bin=1. The second thing to note is that the slope of the scatter plots seem to change from slopes less than 1 for small counts to unity at large counts.
The next figure shows scatterplots of the two statistics for counts/bin equal to 0.3 (red), 0.4 (green), 0.5 (blue), 0.7 (yellow), and 0.9 (black).
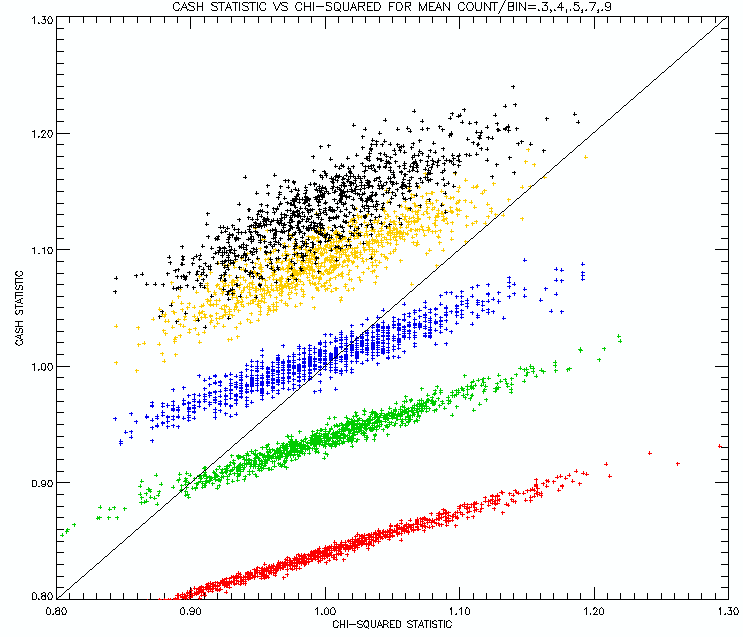 Perhaps not surprisingly, the departure of the Cash Statistic becomes
greater as the count rates become smaller. But the Cash Statistic
becomes much smaller than 1.0 for counts/bin < 0.5. This is an unavoidable
consequence of small-number probabilities.
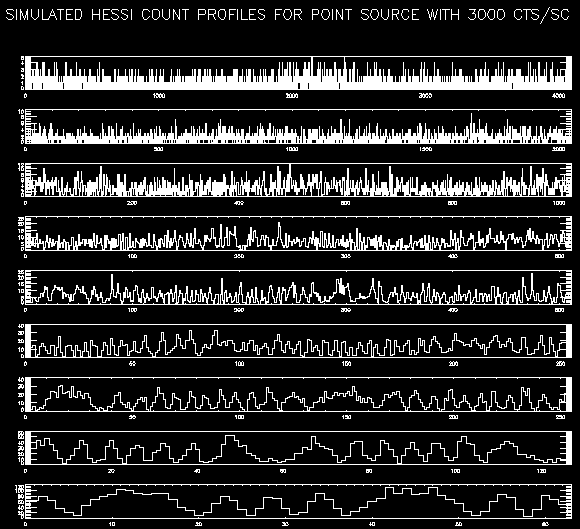
The topmost time profile (for the finest collimator) was fitted to an array of model profiles of a point source with a continuum of fluxes. For the purposes of this test, the location of the source was restricted to the simulated position. The chi-square and Cash statistics were computed for each model, and the results are plotted below as a function of the ratio of the model flux to the observed flux. (The observed flux is obtained from the mean of the observed count profile.)
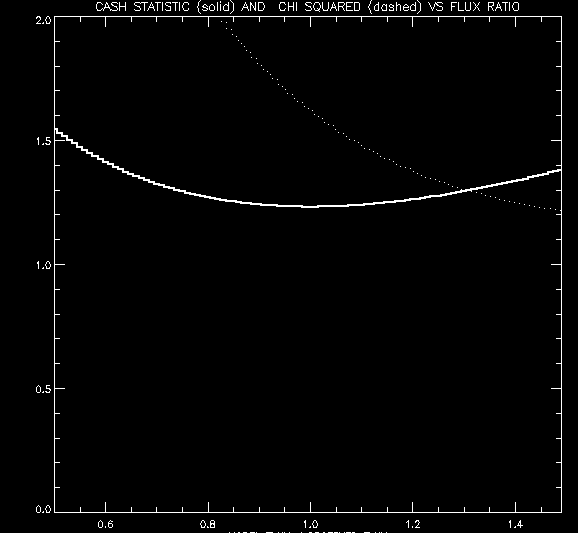
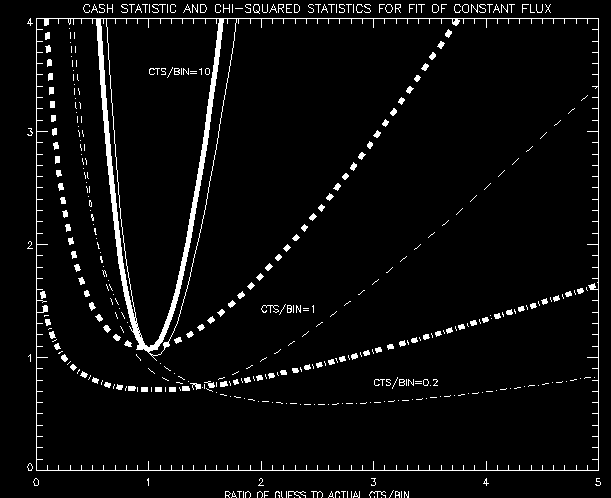
The solid curve for the Cash Statistic shows a minimum at Flux Ratio = 1, while the dashed curve for the Chi-Square Statistic shows a minimum around Flux Ratio = 1.5.
This is shown again for counts/bin =10, 1, and 0.2. The thick curves are for the Cash Statistic , and the thin curves are for the Chi-Square Statistic. When the count rates are high, as illustrated by the two highest parabolic curves, there isn't much difference between the two statistics. The lowest two curves show that at very low count rates. the Chi-Square Statistic is spectacularly bad
