There are circumstances, however, when simply ensuring that there are 4 samples in each cycle is insufficient. This can happen when the pointing is changing at a rate comparable to the motion of the projected grid slats across map center on the Sun. This can result in the phases at map center not uniformly spanning 360 degrees within one cycle.
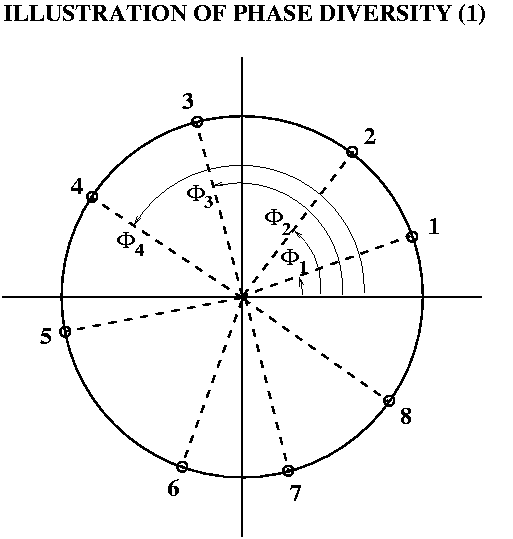
This is most easily illustrated by plotting the phases as azimuths in the phase plane. (See Figure)

|
The phases in this example are represented as azimuth angles for 8 points on a circle. The first 4 phases are indicated by arcs measured from the positive x axis. Clearly, the 8 phases are spread widely enough apart that they would allow a good fit to a sinusoid representing a modulation cycle. The first 4, which span less than 180 degrees, would permit a determination of a sinusoid from the coutrates in the cycle, but it would be less well determined. |
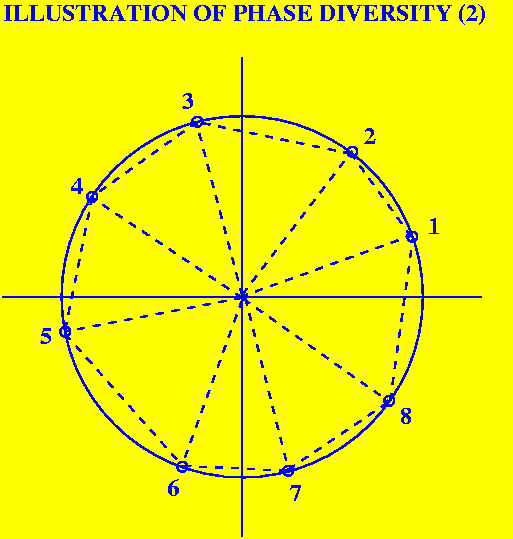
What is a quantitative measure of the amount of "phase diversity" within a cycle? A simple measure can be created graphically from the diagram above. If the small circles at the ends of the radial lines are joined, in the example shown, 8 triangles are formed:

| If, as is true here, the phase angles form a nearly regular figure, the phase diversity is large, and the sum of the areas of the included triangles is close to the maximum possible (the area of a regular octagon, slightly bigger than this slightly irregular octagon .) |

|
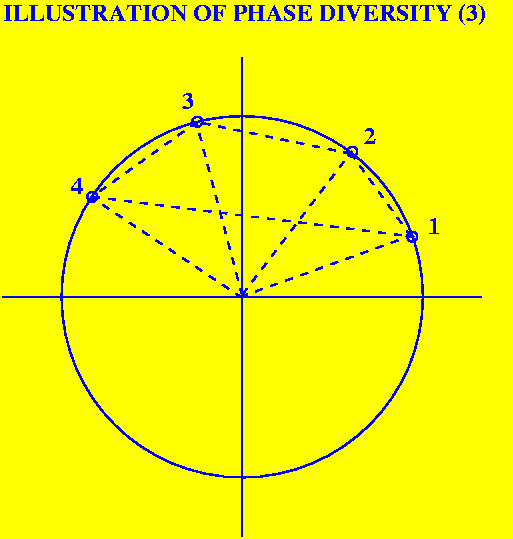
If, however, the cycle is poorly sampled, as shown here for 4 phases, then the total area is less than half the maximum possible, i.e., 2, which is the area of the square inscribed in the unit circle shown in the next figure: |

|
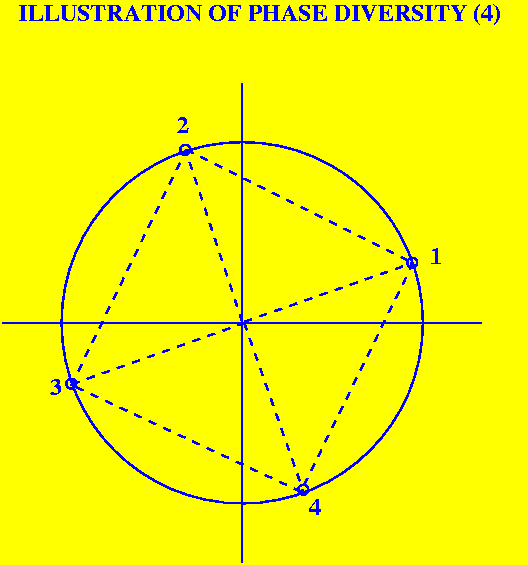
Here the phases are optimally distributed for 4 samples, and the measure of phase diversity is a maximum. |
The expression that gives the ratio of the total area of the triangles associated with N arbitrary phases in one cycle to the maximum possible area is :

This function has a minimum value of 0 (worst phase diversity) and a maximum value of 1 (best phase diversity). It has been coded in the IDL function HSI_PHZ_DIVERSITY.PRO. (Care has been taken to ensure that the phases are sorted after taking them modulo 2 pi.)
function hsi_phz_diversity,phz,VERB=verb
;+
; PURPOSE:
; To estimate the diversity of a phase vector.
; Returns normed sum of the areas of triangles formed by  successive
; phasors exp(i*phz).

; INPUTS:
;     phz = vector of phases (domain: -infinity to +infinity)
;     phz must be sorted in increasing order.  If it is not, then
;        it will be sorted.
;     The phases will be wrapped modulo 2*!pi if max-min GT 2*!pi
;     If VERB is set, informational messages will be printed
; OUTPUTS:
;     diversity (SCALAR)
;
; EXAMPLE:
;  phz=20.+2*!pi*randomu(seed,100)
;  print,hsi_phz_diversity(phz,/verb)
;
; METHOD:
;  Computes sum of the areas of triangles formed by  successive phasors
;    if this is large, the phases are diverse
;    if it is small, the phases are not diverse
;  For N phasors, the largest possible area is (N/2)*sin(2*!pi/N)
;  So the sum is normalized to this value.
;  Good phase diversity occurs when diversity is almost 1.0
;  If the phasors are spread out over
;                                    1 quadrant,  diversity=0.5
;                                    2 quadrants, diversity=0.707
;                                    3 quadrants, diversity=0.79
;
; HISTORY:
;  EJS 10/24/01  schmahl@hessi.gsfc.nasa.gov
;-

N=n_elements(phz)
twopi=2*!pi

if max(phz)-min(phz) GT twopi then  begin
  if keyword_set(verb) then message,'Wrapping phases to 2*!pi',/info
  M=1+long(-(min(phz)<0)/twopi)  ; Number of negative multiples of twopi
  phz=(M*twopi+phz) mod twopi    ; add enough multiples of twopi before modulo
endif

w=where(phz[0:N-2] GT phz[1:N-1],nw) ; if phz is already sorted, nw=0
if nw eq 0 then begin
  f=phz
endif else begin
  if keyword_set(verb) then message,'Sorting phz.',/info
  f=phz(sort(phz))
endelse


area=0.

for j=0,N-2 do area=area+abs(sin((f[j]-f[j+1])))/2.  ; add each triangular area
area=area+abs(sin((f[N-1]-f[0])))/2  ; add last area

diversity=area/((N/2.)*sin(twopi/N))  ; normalize to maximum possible area
if diversity GT 1.0 then message,'ERROR: Phase diversity GT 1'

RETURN,diversity

END