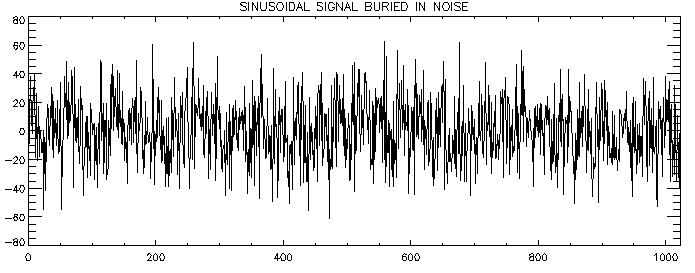
One of the most important uses of the Fourier transform is to find the amplitude and phase of a sinusoidal signal buried in noise. For example, run the following commands in IDL:


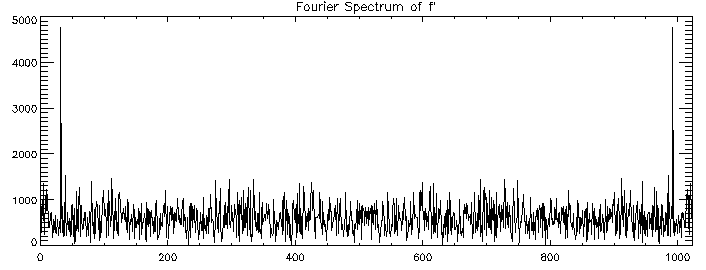
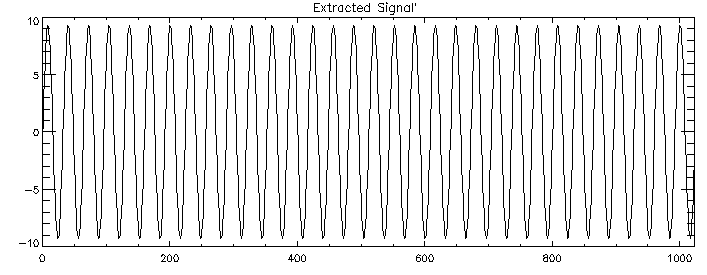
You will see two large spikes standing above some ``spectral'' noise. One of the spikes is at index 32 and the other is at N-32. Now that we see the spikes, we can zero-out the spectral noise, and do the inverse transform to extract the signal:

The extracted signal was simple in this case, but usually there will be
many spikes, and tests must be made to indicate which ones are real and
which ones are not. The most important thing is to determine what the
frequencies are from the spectrum. The rule is simple: period=N/index.
That is, a sinusoid like
![]() produces spikes in the
Fourier spectrum at N/period and N-N/period. The first spike is at
a positive frequency and the second is at a negative frequency.
produces spikes in the
Fourier spectrum at N/period and N-N/period. The first spike is at
a positive frequency and the second is at a negative frequency.
Why negative frequencies? Basically, the reason is that two spikes are required to provide information about both amplitude and phase. We have already seen amplitudes in the previous examples: abs(c[32])and abs(c[N-32]) are both amplitudes. But if you print c[32] and c[N-32], you will see that they have large imaginary parts:
The phase of c[32] is
atan(5328.32,12.4427) = 1.56846 and the
phase of c[N-32] is -1.56846. These are almost exactly ![]() ,
which is the phase of
,
which is the phase of ![]() .
You should have expected this, because
in exponential form,
sin(x)=-i*(eix-e-ix)/2, and the Fourier
series (equation (1)) for sin(x) therefore has two terms:
c-1=i/2and
c1=-i/2.
.
You should have expected this, because
in exponential form,
sin(x)=-i*(eix-e-ix)/2, and the Fourier
series (equation (1)) for sin(x) therefore has two terms:
c-1=i/2and
c1=-i/2.
You may have noticed a difference in indexing between equation (1) and the FFT. This is just something you (and the rest of us) have to live with. The difference is in what the ``fundamental'' frequency is. In the FFT case, the ``fundamental'' is at c[1] and at c[N-1], although if you took an FFT of a series like:
the fundamental would be considered to be A1 cos(t). The difference is a matter of context, and one has to be aware of the context at all times in using FFTs. The same is true of the ``harmonics'': A2 cos(2t) is the 2nd harmonic, A3 cos(3t) is the 3rd harmonic, and so forth. But in the FFT, c[2] is the 2nd harmonic, even if the 2nd peak of the FFT spectrum is at a higher index.
To make this clear, try doing the FFT of the old Sawtooth function.

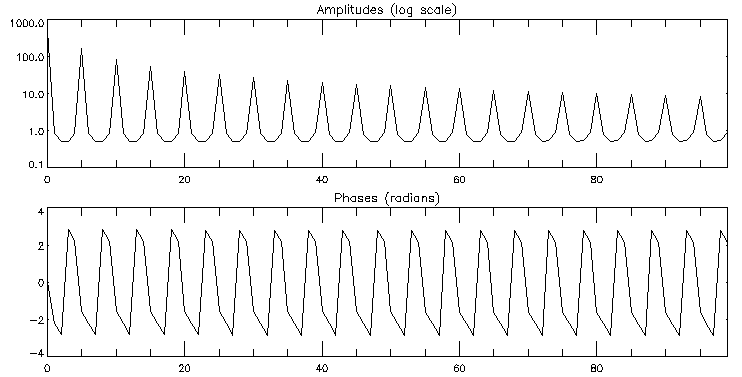
Obviously, most of the ``action'' is in the lowest and highest indices. So plot just the low frequency range:

What you see is a series of amplitude peaks at indices 5,10,15,20,.... The first is the ``fundamental'' of the function f(t) and corresponds to the first positive and negative terms in the Fourier series. The FFT ``fundamental'', however, is at index 1 or -1.
USEFUL TIP:
If you ever get confused by the frequency scale using FFT's, you can always remove all ambiguities by adding a known pure, large-amplitude sinusoidal signal to the input f(t) and look at the FFT both with and without the effect of the pure signal. The two spikes produced by the sinusoidal signal will show you precisely how to convert the FFT index into real frequency. This a simple and useful way to ``calibrate'' your FFTs, as well as an ``idiot'' check for times when you can't figure anything out.
Exercises:
(1) Compute and plot the FFT of a triangle waveform, the basic response of a HESSI subcollimator to translational (as opposed to rotational) motion. The triangle function Tri(x) is defined by this simple program:
| function,tri,x | |
| d=!pi*2 | |
| return,abs(abs(x/d)-fix(abs(x/d))-.5) | |
| end | |
Where are the harmonics of Tri(x), and how fast do they fall off? (Plot the peak of the harmonic amplitudes as a function of harmonic number on log-log coordinates, and see what the slope is.)
(2) Compute and plot the FFT of the HESSI (rotational) response
to a particular point source:
![]() ,
where
t=findgen(1024)/512. and t0 = 0 or 0.5 or 1, and
,
where
t=findgen(1024)/512. and t0 = 0 or 0.5 or 1, and
![]() .
What is the highest frequency in the FFT spectrum? How does it
relate to the fastest modulation in the time series?
.
What is the highest frequency in the FFT spectrum? How does it
relate to the fastest modulation in the time series?
(3) Compute and plot the FFT of a square wave function SW(t).
| function,SW,x | |
| d=!pi*2 | |
| return,float(x/d - fix(x/d) ge 0.5) | |
| end | |
What are the coefficients of the series? Compare them to the coefficients
of the triangle waveform. Plot the magnitude of the two sequences
against each other. How are they related?
For an interesting Java applet showing the successive approximations to a a square wave, have a look at the following URL:
http://sunsite.ubc.ca/LivingMathematics/V001N01/UBCExamples/Fourier/fourier.html