Click here to see the entire HESSI GUI Guide
Click here to see the HESSI Observing Summary
Widget Documentation
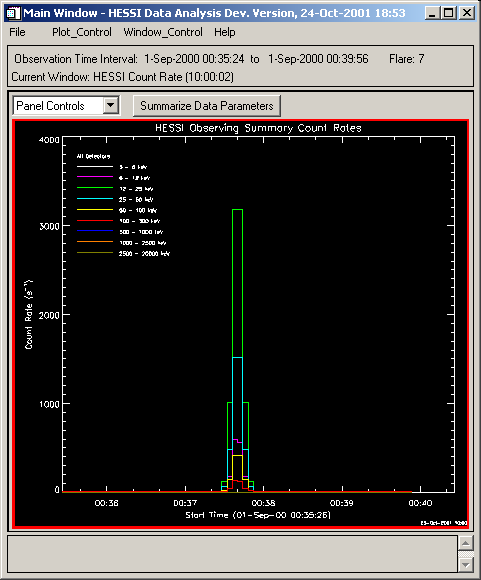
This is a snapshot of a plot created by the HESSI Observing Summary Widget. This is a plot of the count rates for Flare 7 in nine energy bands.
Last updated 01 November, 2001 by Kim Tolbert, 301-286-3965