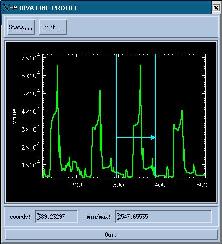
This example shows a horizontal line profile (the image is of a chest of plastic draws) and the corresponding LINE ROI GUI.
The line profile displayed in this GUI is (like most of DIVA's line plotting GUIs) capable of zooming - see below.

[ Home | User Manual | Design | IDL | Links ]
The positional coordinates of the cursor is displayed in the information bar at the bottom of the GUI. Also, the minimum and maximum values are displayed.
2. Other functions
|
This example shows a horizontal line profile (the image is of a chest of plastic draws) and the corresponding LINE ROI GUI. The line profile displayed in this GUI is (like most of DIVA's line plotting GUIs) capable of zooming - see below. |
|
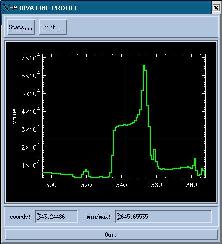
Click, drag and release to zoom into the line profile. This technique can be repeated (the minimum x-range is 5 pixels). Click and release to return to the original range.
The minimum and maximum values are updated to the zoomed
| 
|
[
Home |
User Manual |
Design |
IDL |
Links ]
Copyright © 2003 John Rainnie
Last updated January 2003