THE ZOOM ROI GUI
1. Cursor Information
The positional coordinates of the cursor is displayed in the information
bar at the bottom of the GUI. Also, displayed is the pixel value of that
element.
2. Other functions
- The "Zoom Factor" droplist is used to increase/decrease the
resampling size.
- The "Stats..." button is used to calculate a statistical
analysis of the ROI image. The
results will be displayed in the STATISTICS GUI.
- The ROI image may be exported and printed using the "Print..."
button. Optional file formats include JPEG, TIFF, PS, etc.
3. An Example
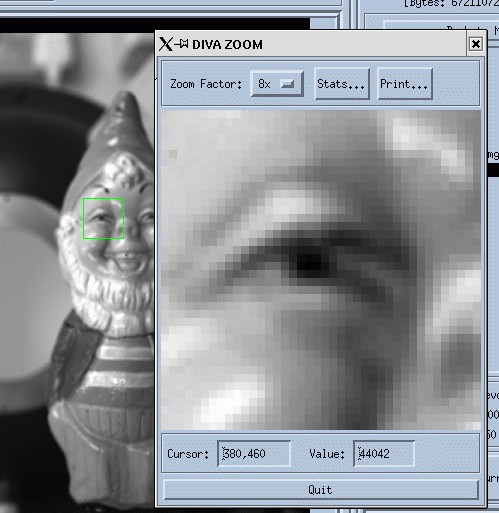
This example shows a portion of an image (a gnome, of course!!) and
a ROI extracted from it (the area within the green rubber-band box).
The ROI image is beside it in the ZOOM ROI GUI.
The zoom factor has been set to 8x (by default this initialised
as 2x). The ROI image was re-sampled to this value.
In order that the ZOOM ROI GUI draw area remain constant (320 pixels),
when the zoom factor is increased, the area of the ROI is decreased (and
vice-versa). The rubber-band box is updated and re-drawn when this occurs.
For example, when the zoom factor is 2x the zoom ROI is an area of
160 x 160 pixels. This is reduced to an area of 80 x 80 pixels when it is
increased to 4x, and is successively halved for each increment.

The positional coordinates of the cursor is displayed in the information bar at the bottom of the GUI. Also, displayed is the pixel value of that element.
2. Other functions
- The "Zoom Factor" droplist is used to increase/decrease the resampling size.
- The "Stats..." button is used to calculate a statistical analysis of the ROI image. The results will be displayed in the STATISTICS GUI.
- The ROI image may be exported and printed using the "Print..." button. Optional file formats include JPEG, TIFF, PS, etc.
This example shows a portion of an image (a gnome, of course!!) and a ROI extracted from it (the area within the green rubber-band box). The ROI image is beside it in the ZOOM ROI GUI. The zoom factor has been set to 8x (by default this initialised as 2x). The ROI image was re-sampled to this value. In order that the ZOOM ROI GUI draw area remain constant (320 pixels), when the zoom factor is increased, the area of the ROI is decreased (and vice-versa). The rubber-band box is updated and re-drawn when this occurs. For example, when the zoom factor is 2x the zoom ROI is an area of 160 x 160 pixels. This is reduced to an area of 80 x 80 pixels when it is increased to 4x, and is successively halved for each increment. | 
|