Flare Loop AsymmetriesThe hard X-ray domain is not usually where one would think of finding diagnostics of coronal magnetic fields, but the shape and cross sections of the flare loops that constrain high energy electrons contain useful information about magnetic fields not obtainable in any other way. One example of such information comes from HXR observations of the footpoints of flare loops, visible as elliptical features in flare images at energies where thick-target emission dominates. It has been known for over a decade, largely from HXT, but also radio, that footpoint fluxes are seldom equal, and that asymmetry is the rule rather than the exception. It is possible that the asymmetry is just due to an asymmetric injection of high energy electrons, but there are new RHESSI observations that seem to favor a symmetric injection.. Back in 1979, before hard X-ray imaging became a reality, Melrose and White presented a trap/precipitation model that suggested that the flux asymmetry of hard X-ray footpoints in flaring loops would be caused by a magnetic asymmetry. In this model, magnetic convergence at the footpoints should mirror a fraction of streaming and spiraling electrons (green spirals in the figure below), and for electrons with small pitch angles (i.e moving more parallel to the magnetic field), where the mirror point lies in the chromosphere, hard X-ray emission would be emitted from regions whose area was that of the trapping magnetic flux tube.
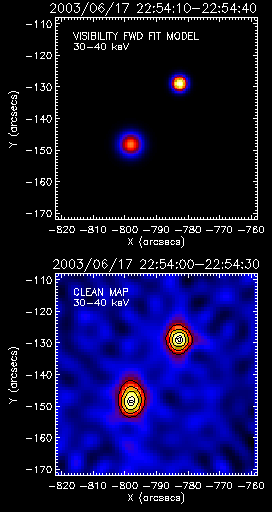
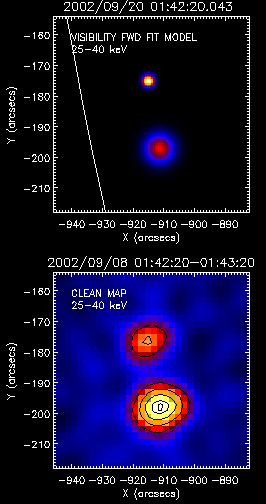
 Figure 1 Cartoon of trap/precipitation model for an asymmetric loop. The footpoint (red) with stronger magnetic field mirrors a larger fraction of the electrons than the other footpoint, and so fewer thick-target hard X-rays are emitted from that footpoint. Thus hard X-ray footpoint flux should correlate negatively with magnetic field strength. As a function of position along the loop, the cross sectional area of the magnetic loop will be inversely proportional to the magnetic field strength, so the footpoint area ratio should equal the reciprocal of the magnetic footpoint field ratio, and hard X-ray flux should correlate positively with footpoint area. The trap/precipitation scenario led many HXT workers to compare hard-X-ray footpoint flux ratios with magnetic fields determined from magnetograms. Taro Sakao, in 1994, devoted part of his PhD thesis to this subject and found that out of 5 flares that he studied, the footpoint with higher magnetic flux (B) was weaker in hard X-rays. This was a vindication of the trap/precipitation model. Later HXT studies by Goff et al. came to a different conclusion than Sakao. Out of 32 flares, only 14 showed the low-B, bright X-ray association. But these studies suffer from the fact that the magnetic fields were measured at the photospheric level, rather that at the chromospheric level where the hard X-rays were emitted. Also, with two different instruments, one has different cadences, resolutions, and pointing systems. So if hard X-ray imaging could determine the area of the footpoints, the asymmetry in both flux and area (inverse magnetic field) could be seen without ambiguity. Unfortunately this was not possible with HXT, nor, until recently, with RHESSI. A new method of imagingIn early 2006 it became possible to make quantitative area measurements with RHESSI data. The method makes use of "visibilities", which are the calibrated amplitudes and phases of the modulation profiles. (A discussion of RHESSI visibilities should be a subject of a future RHESSI Nugget.) To apply visibilities to imaging, one makes an image model with adjustable free parameters. A Fourier transform then provides model visibilities which can be compared with the observed visibilities. The free parameters are adjusted until a good (or the best possible) fit is obtained. This "visibility forward fit" technique is very fast--faster than Clean--and provides error bars derived from the count statistics and the estimated hardware uncertainties, all fed through the nonlinear fitting process. Two examples of forward-fit maps are shown below, along with Clean maps for comparison.
Figure 2 Visibility Forward-Fit maps (top) and Clean maps (bottom) Some observed widths and fluxesWe have selected a sample of 26 double-component events and computed FWHM and flux of each component. The figure below shows the correlation of width and brightness for the pair of (flux,FWHM) values in each event.
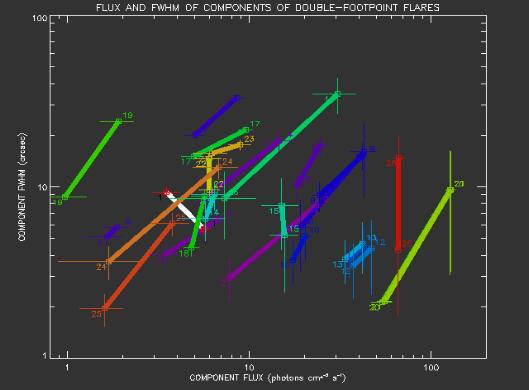 Figure 3. Flux and FWHM of components in double-footpoint flares. Each colored bar represents a separate flare or flare interval, with squares at the bar's end showing the flux and FWHM of that component. Crosses at the end of each bar show estimated 1-sigma errors in flux or fwhm for each component. Note that the slope is positive for all but 3 bars; only one (white bar) of those is significant at the 2 or 3 sigma level. Brighter is broaderWe have found that the brighter footpoint is broader than the fainter conjugate footpoint in 23 of the 26 flare intervals studied. This is shown by the predominantly positive slopes of the line segments joining the footpoint parameters (flux, FWHM) in the above figure. This result validates the Melrose and White prediction, and it is in general agreement with Sakao's result, although the width-flux correlation is better (23/26) than his magnetic field-flux correlation (4/5), and significantly better than Goff et al's result (14/32). The possibility of an asymmetric injection as an explanation for flux asymmetry now seems to be unlikely on the basis of this strong correlation of footpoint flux and area, since if the injection were highly asymmetric in a random way, the correlation would be close to zero.It is also possible to extract information from these width-flux asymmetries about the pitch angle distributions and the loss-cone angles, but that's another story to be told later. AcknowledgmentsWithout Gordon Hurford's invention of RHESSI-style visibilities, this work would have been hugely difficult if not impossible. We also must credit him for the new visibility forward-fit method, which has many potential applications for indirect imaging by RHESSI. |
Next Nugget
Author: Ed Schmahl
Title: Flare Loop Asymmetries Date: August 15 Info updated: Aug.15.06
Comments
Anyone can now add comments to any nuggets.
Just click post a comment. More info.
RSS Feed
 
An RSS feed is available (click above). For more
information on RSS and how to use it click
here.
Email Notification
We release email notifications using the moderated
Max Millennium list.
The Sun : Live

(EIT) Fe IX/X 171 Å
QuickLinks
|
This material is based upon work supported by NASA unless otherwise noted. Any opinions, findings, and conclusions or recommendations expressed are those of the author(s).