
A solar flare is an enormous explosion in the solar atmosphere, involving sudden bursts
of particle acceleration, plasma heating, and bulk mass motion. It is believed to result
from the sudden release of energy stored in the magnetic fields that thread the solar
corona in active regions around sunspots. In the largest flares, 1032 ergs or
more can be released in a few minutes to a few tens of minutes. Such large flares only
occur a few times within a year or two of the maximum in solar activity that occurs every
11 years or so, with the last maximum in 1989. Many smaller flares occur down to the
limits of detectability of modern instruments at about 1027 ergs. These smaller
events generally last for shorter times down to a few seconds; their occurrence rate also
follows the 11-year cycle, peaking at several tens of flares per day.
Solar flares were first detected from their visible or optical
emissions. These so called "white light" flares are rarely
reported since they are difficult to detect against the intense
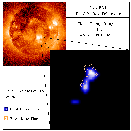
and constant optical emission from the photosphere. Such a flare
is shown below. The companion full-Sun image in soft X-rays reveals
the location on the solar disc of the white light emission. In general,
a solar flare produces copious radiation across the full electromagnetic
spectrum from the longest wavelength radio waves to the highest
energy gamma rays. The contrast over the background (quiet-Sun)
emission is much higher at the shorter X-ray and gamma-ray wavelengths
that will be observed with HESSI. Furthermore, these high
energy radiations carry direct information about the energetically
dominant products of the energy release that is not available from
emissions at any other wavelength. The X rays result from the interactions
of the high energy electrons energized during the flare, and the
gamma rays result primarily from nuclear interactions of the high
energy protons and other heavier ions.
 Solar Flare seen in white light
and in X rays
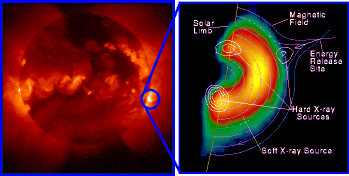
The image in the top left corner (above) shows the full Sun as
seen in soft X rays. The location of the flare is shown by the small
rectangle that is expanded to show the white light (contours) and
hard X-ray (gray scale) images.
During a large solar flare, the X-ray and gamma-ray flux is observed to increase by
many orders of magnitude over preflare levels. Indeed, preflare fluxes are not detectable
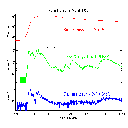
at energies above 10 - 20 keV. The time profile at several different energies for a large
flare on 6 March, 1989, is shown below.
 Solar flare on 6 March 1989
The following different stages can be recognized from this plot:
- The preflare stage from about 13:50 to 13:56 UT in which
the soft X-ray emission gradually increases but little if any
hard X rays or gamma rays are detected above the instrumental
background level.
- This is followed by the so-called impulsive phase in
which the hard X-ray and gamma-ray emission rises impulsively,
often with many short but intense spikes of emission, each lasting
a few seconds to tens of seconds. The soft X-ray flux rises more
rapidly during this phase with its time profile roughly matching
the time integral of the hard X-ray profile in many cases.
- After about 14:06 UT the gradual phase begins, and the hard X-ray and gamma-ray
fluxes start to decay away more or less exponentially with a time constant of minutes. The
soft X-ray flux continues to rise to a later peak and then it too falls exponentially but
with a significantly longer time constant, sometimes as long as several hours.
- In the particular flare shown above, a second phase of hard X-ray and gamma-ray emission
occurs after about 14:10 UT in which the fluxes vary more gradually than during the
impulsive phase. This later, more gradual phase of high energy emissions is not detected
in most flares. Note that the soft X-ray flux continues to fall smoothly during this
phase.
The X rays and gamma rays are produced by several different processes
with the result that a complex spectrum is produced involving both
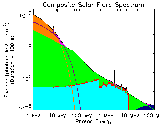
line and continuum emission. A composite spectrum of a large flare
is shown in the figure below, where the contributions to the total
emission are indicated in the different energy ranges. The longer
wavelength or softer X rays from less than 1 keV to several tens
of keV are produced by hot plasma with a temperature of at least
107 K (and possibly as high as several times 108
K in some cases).
 Composite Solar Flare Spectrum
of X rays and Gamma Rays
Plasma at such high temperatures emits soft X rays through the
interactions of free electrons with the nuclei (primarily protons)
of the plasma. This radiation is called bremsstrahlung (from the
German word meaning "braking radiation") since the radiation
is produced as the electrons are deflected in the Coulomb field
of the ions. This type of emission from a plasma at a given temperature
has a characteristic continuum spectrum that falls off exponentially
with increasing energy, the e-folding energy being a measure of
the temperature of the plasma. In an inhomogeneous plasma with a
distribution of temperatures, more complicated spectral shapes are
possible. Detailed spectral measurements of this emission can be
used to determine the distribution of emission measure over temperature
for the plasma in the emitting volume.
Shorter wavelength or harder X rays with energies greater than
10 keV are also believed to be electron-ion bremsstrahlung, but
they are produced by electrons that have been accelerated to much
higher energies than those found in the ambient plasma. The resulting
bremsstrahlung spectrum, in general, will not have the exponential
behavior characteristic of a thermal source. Spectral measurements
of such hard X rays do indeed show a less steep fall-off than at
lower energies, often with a power-law rather than an exponential
shape. The bremsstrahlung spectrum can extend up into the gamma-ray
range. Indeed, in some of the biggest flares, the spectrum is seen
to extend to energies in excess of 100 MeV. As we discuss below,
the hard X-ray emission contains unique information, not only on
the spectrum of the high energy electrons accelerated during the
flare, but also on their locations in the flaring volume and on
their impulsive temporal variability.
At even higher energies, we find gamma rays produced, not from the flare electrons, but
from nuclear interactions of the protons and heavier ions accelerated in the flare. These
high energy particles interact with the nuclei of the different elements in the ambient
solar atmosphere to produce a far more complicated emission spectrum than the relatively
smooth continuum bremsstrahlung spectrum. Many individual gamma-ray lines from a wide
variety of different elements in the solar atmosphere have been detected. They result from
the decay of such relatively abundant elements as carbon, nitrogen, oxygen, etc. that are
excited to high energy states in the various nuclear interactions. The relative
intensities of the various lines provide information about the composition of both the
accelerated particles and the target nuclei.
Furthermore, the lines are Doppler broadened and shifted because of the high velocities
of the nuclei as they decay and emit the gamma rays. Consequently, the widths and detailed
shapes of the lines can reveal the distribution of velocities of the emitting particles
and hence also impose severe constraints on the acceleration mechanism itself. Despite the
wealth of information believed to be available from observations of these gamma-ray lines,
no gamma-ray spectrometer with the resolution necessary to reveal anything other than the
intensities of the strongest lines has ever been flown.