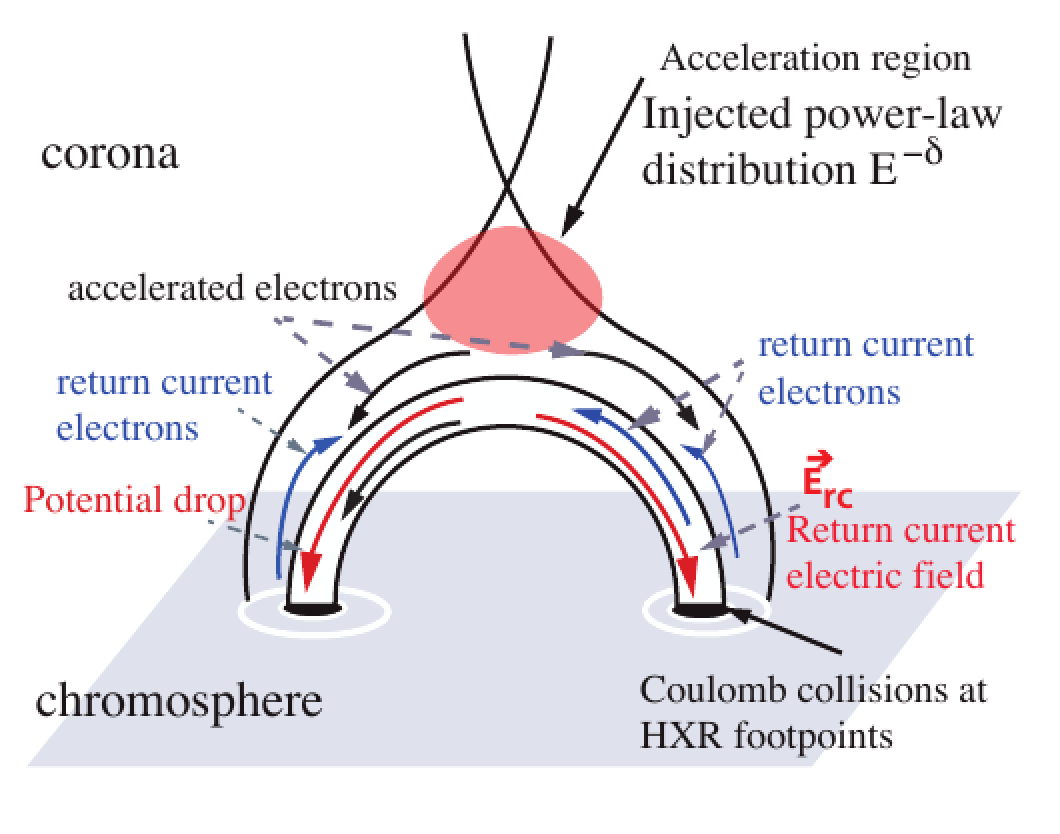
Parameters shown in the table correspond to the highest HXR peak time (in black), or the time interval with the highest potential drop during the flare
Click on the flare date to view the time evolution of fitted and derived parameters, asterisk denotes flares that have not been used in analysis
Click on "Uncertainties" for time evolution plots of parameters where width of curve is 67% confidence interval from 1000 Monte Carlo runs
Click on "spectra" for a movie of all fitted spectra for each event
Click on "source images" for a figure of the CLEAN footpoint and thermal source
| Flare | Figures and movies | EM [1049cm-3] | T [MK] | V [keV] | δ near acceleration | χ2 (normalized) | Ec max [keV] | Ec min [keV] | Fe0[e-cm-2s-1] | ℱ0 [erg cm-2s-1] | |
|---|---|---|---|---|---|---|---|---|---|---|---|
| 26-Feb-2002(SD) Uncertainties 67% |
Source images |
0.06-0.01+0.01 |
22-0.6+0.6 | 49-1+0.6 | 5.3-0.06+0.05 | 1.5 | 78-6+3 | 10-0.4+0.2 | 2e20-0.2+0.4 1.2e18-0.3+2.8 |
4.4e12-0.3+0.7 1.2e11-0.2+1.4 |
|
| 02-Jun-2002(SD) Uncertainties 67% |
Spectra Source images |
0.009-0.0007+0.003 |
20.7-0.7+1.0 | 13-12+33 | 3.5-0.1+0.9 | 1.2 | 18-8+36 | 18-3+6 | 6e16-4+10 4.7e16-2.4+31 |
9.7e8-0.1+77 2.9e9-1.3+4.2 |
|
| 22-Aug-2002* | Spectra Source images |
N/A | N/A | N/A | N/A | N/A | N/A | N/A | N/A | N/A | |
| 28-Aug-2002(SD) Uncertainties 67% |
Spectra Source images |
0.01-0.001+0.07 |
32.5-3.2+2.0 | 21-1+125 | 4.3-0.3+6.4 | 1.0 | 68-4+247 | 20-12+11 | 1.7e19-1.2+1.7 2.1e17-0.4+2.9 |
6.3e11-3.9+4.1 2.3e10-0.2+0.9 |
|
| 26-Apr-2003* Uncertainties 67% |
Spectra Source images |
0.04 | 28 | 37 | 4.7 | 60 | 11 | 1.44 | 2.3e19 6.0e16 |
7.2e11 7.9e9 |
|
| 27-Apr-2003* Uncertainties 67% |
Spectra Source images |
0.03 | 23 | 35 | 5.3 | 0.72 | 59 | 10.6 | 8.8e19 5.4e16 |
1.9e12 6.7e9 |
|
| 08-Jun-2003(SD) Uncertainties 67% |
Spectra Source images |
0.06-0.005+0.01 | 33.6-0.8+2.1 | 30-8+18 | 5.7-0.3+0.7 | 1.3 | 55-14+22 | 19-3+3 | 1.2e19-0.3+0.8 8.9e17-1.6+8.4 |
4.8e11-1.2+1.8 2.3e10-0.2+0.9 |
|
| 13-Jun-2003(SD) Uncertainties 67% |
Spectra Source images |
0.009-0.001+0.006 | 33.5-3+4 | 13-3+60 | 4.8-0.4+1.5 | 1.08 | 29-11+51 | 14-2+7 | 2.2e19-1.3+0.2 8.4e17-1.1+8.9 |
7.6e11-4.0+0.9 5.4e10-1.2+1.8 |
|
| 17-Jun-2003(LD) Uncertainties 67% |
Spectra Source images |
0.3-0.06+0.1 | 27-1+1 | 77-25+66 | 4.85-0.04+1.7 | 1.12 | 103-31+75 | 12-1+4 | 2.7e19-0.4+0.8 3.6e17-0.8+2.3 |
6.7e11-0.6+2.7 1.7e10-0.2+0.9 |
|
| 03-Nov-2003(LD) Uncertainties 67% |
Spectra Source images |
2.4-0.1+0.1 | 35-0.3+0.2 | 97-47+88 | 5.9-0.8+1.9 | 1.03 | 156-66+95 | 18-3+6 | 5.1e18-1.9+1.7 7.9e16-2.3+5.8 |
1.8e11-0.5+0.4 8.6e9-1.5+2.7 |
|
| 17-Jan-2005(MD) Uncertainties 67% |
Spectra Source images |
2.7-0.7+0.8 | 22-1+1 | 75-10+43 | 4.3-0.1+0.5 | 0.94 | 97-17+56 | 9-1+1 | 9.8e18-0.5+2.5 1.3e17-0.4+0.5 |
2.0e11-0.2+0.3 6.4e9-1.2+1.7 |
|
| 19-Jan-2005(LD) Uncertainties 67% Neupert GOES temp |
Spectra Source images |
1.85-0.2+0.3 | 24-0.3+0.8 | 258-51+60 | 5.9-0.5+0.6 | 1.03 | 326-66+67 | 12-1+2 | 2e19-0.3+0.2 9.4e16-0.8+2.8 |
4.9e11-0.8+0.7 1.3e10-0.1+0.1 |
|
| 20-Jan-2005 Uncertainties 67% Neupert GOES temp |
Spectra Source images |
2.5-0.04+0.07 | 40-0.2+0.2 | 87-14+19 | 4.7-0.1+0.2 | 0.99 | 144-11+21 | 16-1+1 | 7.8e18-0.6+1.4 2.4e17-0.1+0.1 |
2.9e11-0.2+0.3 3.4e10-0.2+0.2 |
|
| 21-Jan-2005(SD) Uncertainties 67% |
Spectra _Source images |
0.2-0.09+0.25 | 25-2.6+4.7 | 39-4+8 | 4.4-0.1+0.1 | 0.89 | 75-38+26 | 15-1+34 | 3.3e18-0.4+1.1 9.1e19-0.1+2.5 |
2.6e11-1.0+0.7 3.0e12-0.08+0.8 |
|
| 30-Jul-2005(MD) Uncertainties 67% |
Spectra Source images |
0.9-0.1+0.1 | 25-0.2+0.7 | 59-19+27 | 4.7-0.3+0.7 | 0.71 | 103-34+33 | 10-1+1 | 3.5e19-0.4+0.6 1.9e17-0.3+1.9 |
8.3e11-1.1+2.0 1.9e10-0.2+0.6 |
|
| 06-Dec-2006(LD) Uncertainties 67% |
Spectra Source images |
4.3-0.2+0.3 | 29-0.3+0.3 | 141-18+22 | 5.2-0.2+0.2 | 1.11 | 168-24+39 | 13-1+1 | 9.0e19-0.6+0.8 1.9e18-0.5+0.5 |
2.5e12-0.2+0.1 1.2e11-0.2+0.06 |
|
| 14-Dec-2006(MD) Uncertainties 67% |
Spectra Source images |
4.3-0.2+0.3 | 29-0.3+0.3 | 141-18+22 | 5.2-0.2+0.2 | 1.11 | 168-24+39 | 13-1+1 | 9.0e19-0.6+0.8 1.9e18-0.5+0.5 |
2.5e12-0.2+0.1 1.2e11-0.2+0.06 |
|
| 26-Sep-2011(SD) Uncertainties 67% |
Spectra Source images |
6.2-0.2+0.3 | 33-0.3+0.3 | 64-18+22 | 5.3-0.2+0.2 | 1.11 | 74-24+39 | 15-1+1 | 2.4e19-0.6+0.8 1.1e18-0.5+0.5 |
7.6e11-0.2+0.1 5.0e10-0.2+0.06 |
|
| 13-May-2013(LD) Uncertainties 67% |
Spectra Source images |
1.3-0.7+1.3 | 33-0.2+2.0 | 116-75+114 | 4.8-0.2+0.2 | 0.88 | 149-78+130 | 19-1+1 | 2.1e+19-0.1+0.9 8.2e18-0.7+1.1 |
6.8e+11-0.3+2.5 6.5e10-0.5+30 |
|
| 29-Mar-2014(LD) Uncertainties 67% |
Spectra Source images |
1.0-0.06+0.5 | 34-0.4+2.5 | 38-24+23 | 3.7-0.1+0.2 | 0.76 | 53-4+13 | 7-1+2 | 1.0e+17-0.3+1.5 8.2e18-0.7+1.1 |
9.1e+10-0.4+2.4 4.4e9-0.6+5.4 |
|
| 05-May-2015(MD) Uncertainties 67% Neupert GOES temp |
Spectra Source images |
N/A | N/A | N/A | N/A | N/A | N/A | N/A | N/A | N/A |
Absence of Neupert effect in long duration flares
M and X class flares spectral analysis results
M and X class flares with background density > 10^10 cm^-3