RHESSI Aspect Solution
The RHESSI aspect system consists of a Solar Aspect System (SAS), and two redundant roll aspect systems: a CDC-based Roll Aspect System (RAS), and a Photo-Multiplier Tube Roll Aspect System (PMTRAS). The "solar limb" data from the SAS provides sub-arcsec knowledge of the radial pointing with respect to Sun center, and the "star event" data from one of the RAS systems provides precise knowledge of the roll angle of the rotating spacecraft. The combined SAS/RAS aspect system yields the absolute pointing with an accuracy of 1 arcsec.
RHESSI image reconstruction relies on this precise knowledge of the pointing and roll angle of the spacecraft. The software uses the high-resolution aspect information to interpret the modulation patterns produced by the rotating modulation collimators to generate images with 2 arcsec resolution.
RHESSI spectral analysis also uses the aspect information when constructing the detector response matrices (DRM , also called SRM) used in OSPEX.
On this page: | External Links:
|
RHESSI Aspect Solution Software Basics
The aspect solution object is one of the underlying objects in the image object chain, but also be used as a standalone object.
To retrieve the aspect object from an image object called o, or to retrieve the aspect data from the image object:
aobj = o -> get(/obj, class='hsi_aspect_solution')
data = o -> getdata(class='hsi_aspect_solution')
To create a standalone aspect object and retrieve data:
aobj = hsi_aspect_solution()
aobj -> set, obs_time_interval=$
['12-Aug-2002 02:19:19.776', '12-Aug-2002 02:19:36.224']
data = aobj -> getdata()
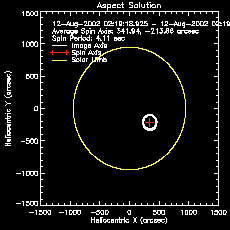
Details of the data structure returned are in the User's Guide. To plot the pointing information,
aobj -> plot
The resulting plot is shown at right, showing the image axis in white and the spin axis in red for the above example.
Roll Database
The default method for determining the roll for a specified time interval is the DBASE method. This method queries the roll solution database that has been manually created for some RHESSI time periods. The roll database files are stored in $HSI_ASPECT (environment variable that normally points to $SSW/hessi/dbase/aspect). As of April, 2011, the monthly roll database files have been made for the period from February 2002 (mission start) to the end of 2003.
The DBASE method is most reliable because someone has verified the roll data in the database. If the time requested is not in the database, then the software tries to compute the roll from the PMTRAS data, and if that fails, then from the CCD-RAS data. You can override this heirarchy by setting
o->set,as_roll_solution='xxx'
where xxx is DBASE, PMTRAS, RAS, or FIX (which uses the value of as_roll_offset as a start roll angle, and assumes a fixed spin period of the value as_spin_period).
If the software can't compute the roll angle for your specific time period, you may submit a request for the roll database to be updated for your time interval (send message to hessibugs@hesperia.gsfc.nasa.gov).
Aspect Solution for SRM
In computing the Detector Response Matrix (DRM, also called SRM, needed for detailed spectral analysis), an aspect solution is needed in order to make a small correction based on the 'offax_position', the angle between the source and the imaging axis. If there are problems creating the aspect solution for your time interval, rather than the entire SRM creation aborting, you can turn off this small correction by setting
o->set,compute_offax_position=0
Alternatively, if you think it's an important factor, you can set offax_position manually by retrieving it for a nearby time that does have an aspect solution and setting it in your object.
Interpreting PMTRAS Diagnostic Plots
Gordon Hurford, 11 July 2002
The PMTRAS software issues a "WARNING PMTRAS solution is suspect" message if any one of several internal checks is not satisfactory. Generating a complete set of diagnostic plots by using the "pmtras_diagnostic = -1" keyword may help identify the reason for the problem. In response to pmtras_diagnostic = -1, you will typically get some extra screen output and 11 plots, of which 5 may be relevant in this context. The purpose of this writeup is to suggest how these diagnostics might be interpreted to help resolve the problem.
The 4th plot, "Blip Total vs. Time" should be examined for any gaps (>=1 minute). Such gaps are probably due to missing packets, in which case obs_time_interval and/or ras_time_extension should be modified to avoid inclusion of such a gap. (The solution is based on PMTRAS packets starting within +-ras_time_interval of the obs_time_interval. Default value of ras_time_interval is +-1400s.)
The 6th plot, "Preliminary Estimates of Rotation Period" has data points which are normally spaced at 3 minute intervals. This should be checked for any missing data points. Gaps here indicate a virtually blank star field for that part of the orbit. Again, obs_time_interval and/or ras_time_extension should be modified to avoid inclusion of such a time gap.
Over an orbit, the range of the Rotation Periods should typically be ~2 milliseconds. Except for characteristic hiccups at sunrise and sunset, the successive periods should represent a reasonably smooth curve (with 'noise' at the 0.1 millisecond level). If this is not the case, using the blip_min=x keyword (where x is higher or lower than the Blip Intensity cutoff indicated in the output) might help. Alternatively, obs_time_interval or ras_time_extension might be modified to avoid inclusion of the offending point.
The 11th plot, "File-Averaged Phase Residuals" shows the residual phase of all the star-associated blips, after removing the best fit uniform rotation period. Since all stars should lie on the same curve, this plot must be single valued for a reliable solution. Double-values anywhere suggest that the entire solution may be suspect (due to star misidentification). Red +'s represent discarded outliers and can be disregarded. Gaps are ok here as long as they do not include times that overlap with the actual imaging time_range and as long as linear interpolation between adjacent data points seems appropriate. If there are gaps or double-valued regions, then again, obs_time_interval and/or ras_time_extension should be modified to try to alleviate the problem. (The time range has some affect on which stars are identified and then used in the final solution.)
The 9th plot, "Intensity/Phase Grouping" is very instructive for getting insight into what is actually happening, although there is no one-to-one correlation between plot characteristics and "fixes". In this plot, individual star blips are shown as white dots, plotted as intensity vs. relative rotational phase (or position angle). A given star will always have the same phase and a (~x2) range of intensities and so will show up as a narrow vertical bar. (PMTRAS is not a good photometer!) The orange boxes surround groups of blips that are then assumed to come from the same star. The yellow diamonds represent the expected stars that might be observed, shown shifted in phase to best match the observed groups of blips. When a star has been associated with a blip group, a red X is plotted as well. The predicted and observed star intensities should agree to within ~x3. The robustness of the star association (viz. correctness of the position angle of your image) can be judged by the number of associated stars and the (undesirable) potential for alternate but equally valid associations. In this regard, more associated stars is good, Closely spaced stars or closely spaced blip groups are not good.
The 7th plot (Preliminary Timing Residuals) shows individual blip phases as a function of a timing residuals, assuming the preliminary rotation periods. (The timing residuals are closely linked to the relative rotational phase in the Intensity/Phase Grouping.) All blips for an individual real star should show up as a horizontal line. (Diagonal lines may be city lights.) When interpreted in conjunction with the other plots, it can provide insight into why gaps may have occurred at different phases in the orbit.
Questions concerning interpretation of pmtras data should be sent to: ghurford@ssl.berkeley.edu