Quicklook Browsing
New RHESSI Flare Image Archive - Tolbert/Schwartz
We have generated science-ready images for all flares observed by RHESSI that meet certain criteria. The link above has pulldown options to select the year and month of the RHESSI Image Archive to load. In the monthly lists, clicking the flare time in the far left column will bring up a page showing the flare details.
Please see the RHESSI Image Archive Strategy for information on how the parameters for imaging, including the time and energy bins, were chosen. Please see the Guide to RHESSI Image Archive for an explanation of how to access the archive, and a detailed description of each type of plot shown in the archive.
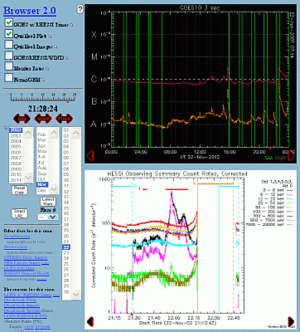
The RHESSI Browser interface lets you view a variety of previously generated quicklook plots for a selected time or flare.
In the Browser, use the buttons on the left to select a GOES time profile overlaid with RHESSI observing times, RHESSI time profiles and images, WIND spectrograms, and/or Fermi GBM time profiles.
Click in any of the plots to adjust all visible plots to that time. Click directly on the little red time arrow to toggle the display of a vertical red line.
More information:
- Explanation of RHESSI Quicklook Light Curves
- Explanation of RHESSI Quicklook Images
- Artifacts in RHESSI Light Curves
Major Events, 2002-2007 - Smith
Data Gaps (text files and plots)
State of Health (text files and plots)


