RHESSI Mission Archive
RHESSI was in operation for more than 16 years, from February 2002 to April 2018, recording over 100,000 events over more than a complete 11-year solar cycle. The final Mission Archive contains the datasets, plots, and software listed below. The goal is to facilitate current analysis of RHESSI observations, and to ensure continued use of the RHESSI science data in the future. The archive will be hosted here on the RHESSI web site on the hesperia server, as well as in the deep repository at the Solar Data Analysis Center (SDAC) at Goddard.
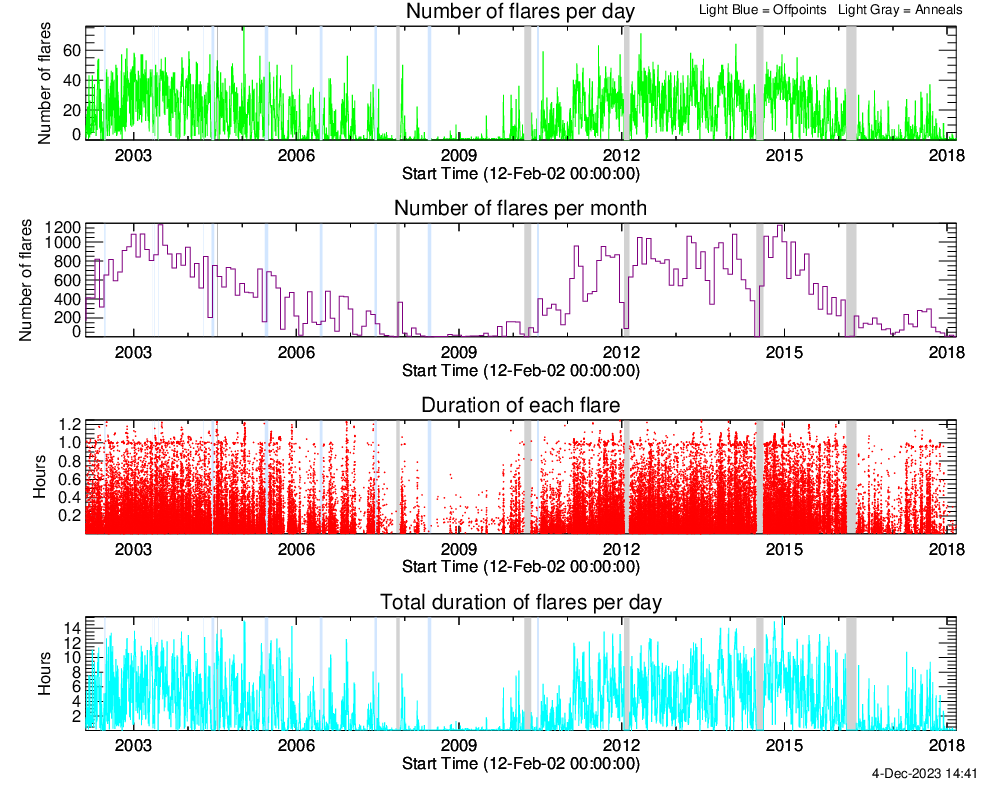
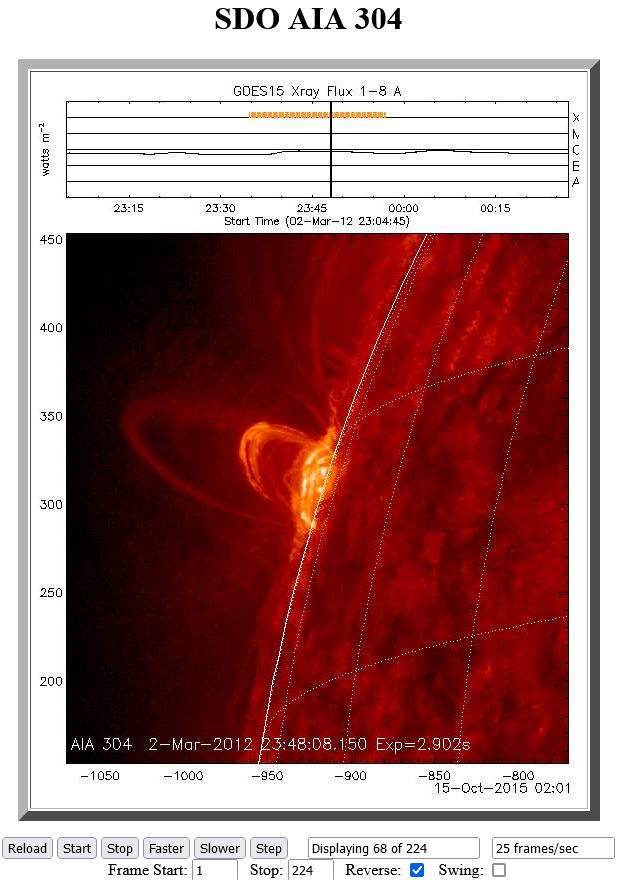
Click the image below to see the distribution and duration of flares throughout the RHESSI mission:
Software
The software tools for reading and analyzing RHESSI data are written in IDL and are stored in the "hessi" branch of the SolarSoft library. IDL version 6.0 or higher is required. Please refer to the RHESSI software web pages for information on installing and using the RHESSI software.
For analysis using the full capability and flexibility (high time and energy resolution) of the RHESSI data, input to the RHESSI software is the Level-0 files, the eventlist files, or the visibility files, all described below. For quicklook analysis, input to the RHESSI software is the quicklook observing summary files described below.
The RHESSI IDL software can be used either through the IDL command line interface, or through a RHESSI GUI (invoked by typing hessi in SSWIDL).
In recent years, many of the RHESSI software tools have been converted to Python as part of the SunPy project. (SunPy website)
Data
- Level-0 Files - Raw telemetry data in packed format for full mission. Require RHESSI SSW software to interpret. (more info)
- Eventlist Files - Intermediate files containing time and energy information for every photon detected by RHESSI. Can be used as input to the RHESSI software instead of the Level-0 files. Eventlist files were created for every flare that is in the RHESSI image archive for the energy range 3.0-310.0 keV. (more info)
- Visibility Files - Visibilities represent a compact, noise-free transformation of the input imaging data, containing all the information required for image reconstruction. Visibilities can be used standalone, or as input to the RHESSI imaging software (for visibility-based reconstruction algorithms). (more info)
Two types of visibility FITS files have been created for every flare in the RHESSI image archive:- Standard Resolution Visibility Files - same time and energy bins used in the image archive
- High Resolution Visibility Files - 8s time bins, and up to 20 energy bins
- Quicklook Files - Daily Observing Summary FITS files containing pre-binned rates in 4s time bins and nine energy bands. The hsi_obssumm_yyyymmdd_vvv.fits files contain those rates for all detectors combined (front and rear segments), as well as ephemeris, roll and pointing data, and monitor and packet rate data, and flags with information about day/night boundaries, attenuator state changes, etc. The hsi_fullrate_yyyymmdd_vvv.fits files contain those rates for each separate detector segment. (more info here and here)
- Spectrum Files -
- Standard Energy Resolution - For every orbit of the RHESSI mission (midnight-to-midnight), count spectrum files with 4s bins, 77 energy bins 3-250 keV, combining all functional detectors (front segment only). For every flare, there are Spectral Response Matrix (SRM) files with the same energy bins and the same combined detector segments as in those spectrum files.
These spectrum and SRM files can be displayed and analyzed in OSPEX. In the OSPEX GUI, these files can be automatically found and downloaded based on your selected time. - High Energy Resolution - For the larger RHESSI flares (events seen above 50 keV), count spectrum files for the orbit containing the flare (midnight-to-midnight) for each separate detector (front segment only), with 4s time bins and energy bins from 3 keV to 3 MeV, starting with 1/3 keV bins up to 15 keV and larger bins for higher energies, but finer bins surrounding each line. A combined-detector (all functional front detectors) file is also provided. The corresponding Spectral Response Matrix (SRM) files are also provided. (more info)
These spectrum and SRM files can be displayed and analyzed in OSPEX. In the OSPEX GUI, these files can be automatically found and downloaded based on your selected time. - Gamma-ray Events - In progress. For the less than 20 RHESSI gamma-ray flares, spectrum and SRM FITS files at appropriate energy and time binning, as well as FITS files of suitable background for each flare.
- Standard Energy Resolution - For every orbit of the RHESSI mission (midnight-to-midnight), count spectrum files with 4s bins, 77 energy bins 3-250 keV, combining all functional detectors (front segment only). For every flare, there are Spectral Response Matrix (SRM) files with the same energy bins and the same combined detector segments as in those spectrum files.
- Imagecube FITS files - FITS files containing the images in the RHESSI Image Archive. For information on how to use the imagecube FITS files please see this.
- Flare List - List of 104,036 events observed by RHESSI. (more info)
Prepared Plots
These plots are all available through the RHESSI Browser. The RHESSI Browser is a web interface to a large set of RHESSI-related generated plots - those listed below, and more. Users select a date, click check boxes to select which plots to display, and move forward or backward in time by clicking the red Day, Orbit, or Flare buttons, or the arrows at the bottom of each plot.
- Plots for all times in the RHESSI mission:
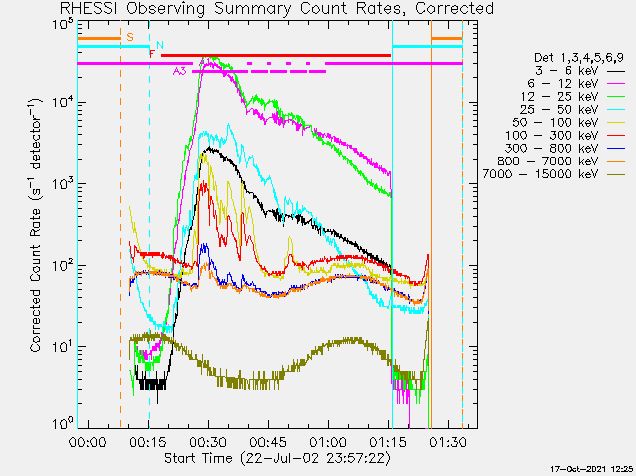
- Quicklook Time Profiles - Time profiles of RHESSI Observing Summary Count Rate for every orbit, 4s time bins, 9 energy bands, all functional detectors (both front and rear segments). Includes rates corrected and uncorrected for attenuator state changes, as well as front and rear detectors separately, particle rates, and more. (more info here and here)
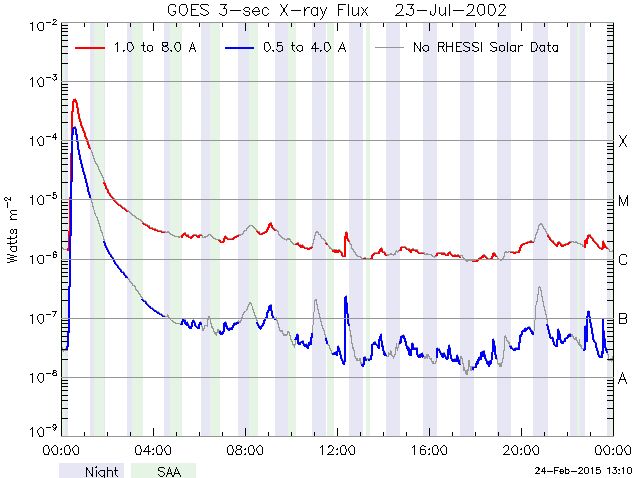
- GOES/RHESSI Time Profiles - 24-hour GOES time profile overlaid with RHESSI observing times for every day of mission. Also available in stacked 12 hour plots and plots for each RHESSI orbit.
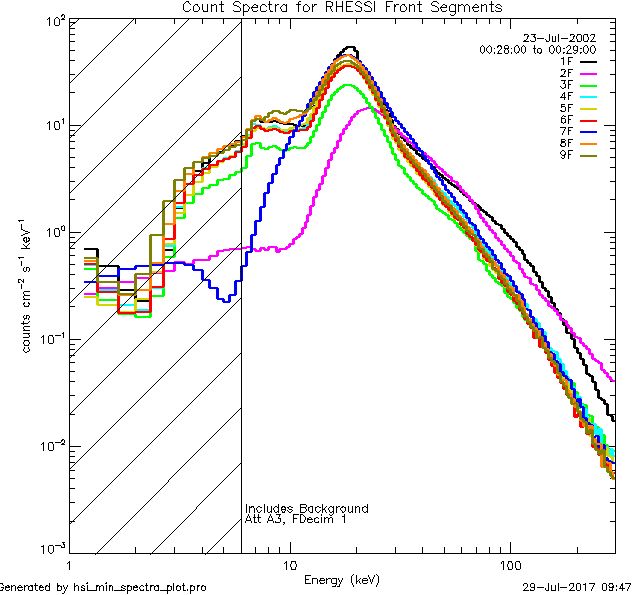
- Minute-by-minute Spectra - Plots of count flux spectrum of each front segment for each minute of the mission in 138 energy bins from 1-300 keV. The spectrum FITS files used to make those plots are also available (one orbit, one front segment per file, no corresponding SRM files).
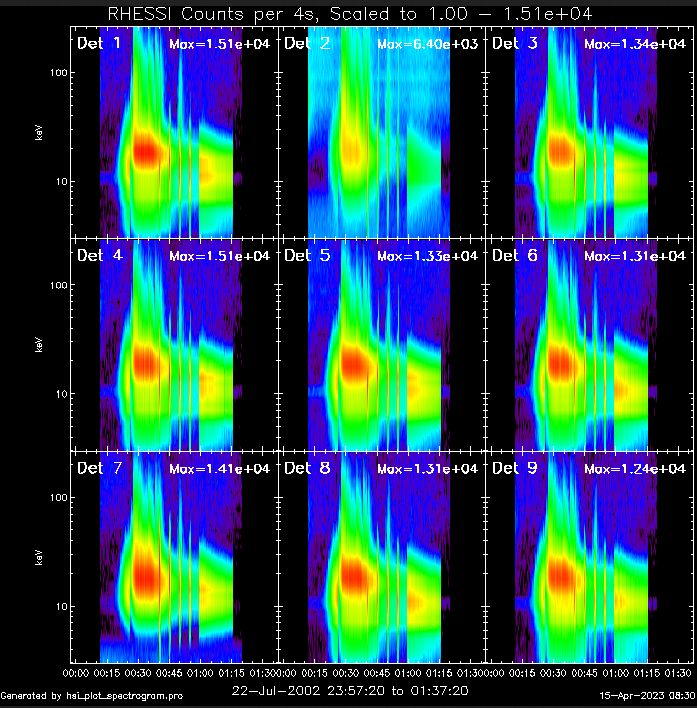
- Spectrograms in Counts or Count Flux Units - Spectrograms of every front segment for every RHESSI orbit in 4s time bins, 39 energy bins from 3-270 keV. The spectrum FITS files created to make these plots are also available.
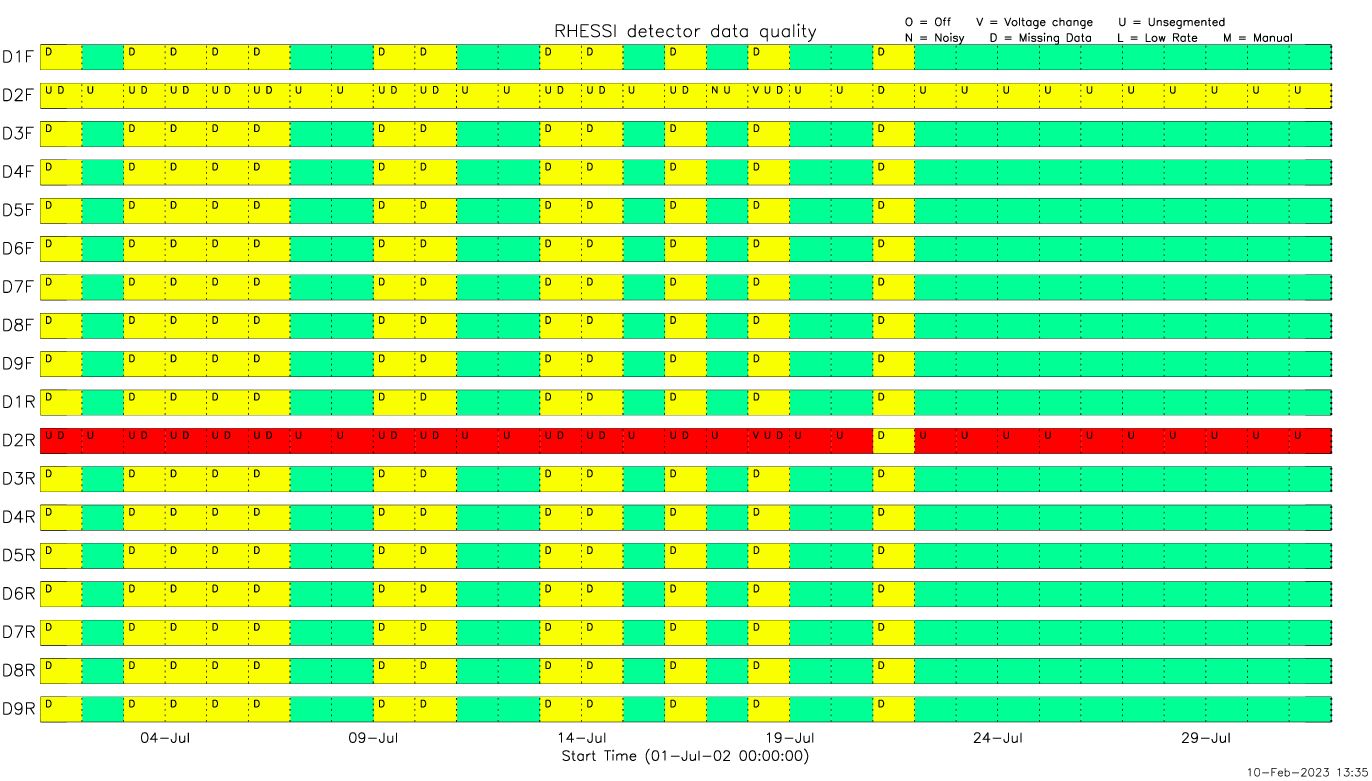
- Detector Health - Monthly plots showing the status for all detector segments for each day. (more info)
- Plots for RHESSI flare time intervals:
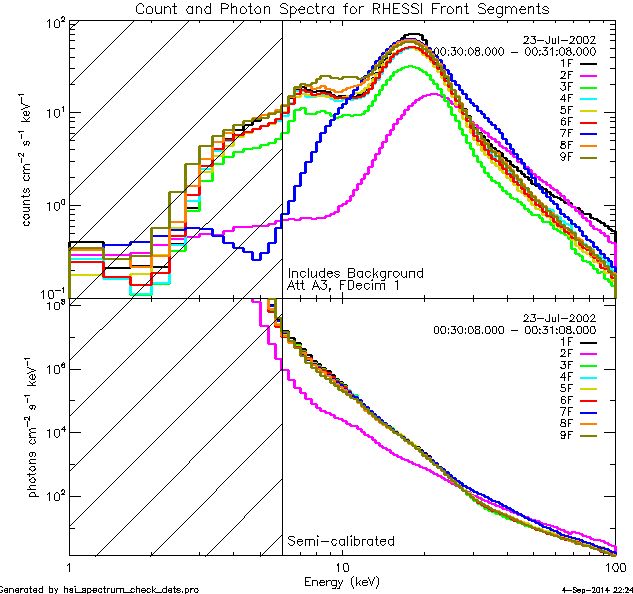
- Count and Photon Spectra - Count and photon flux spectra for each front detector segment for each RHESSI flare for one minute centered on peak time of flare, in 138 energy bins from 1-300 keV. Photon flux is computed using the semi-calibrated option which provides only a rough estimate of photon flux.
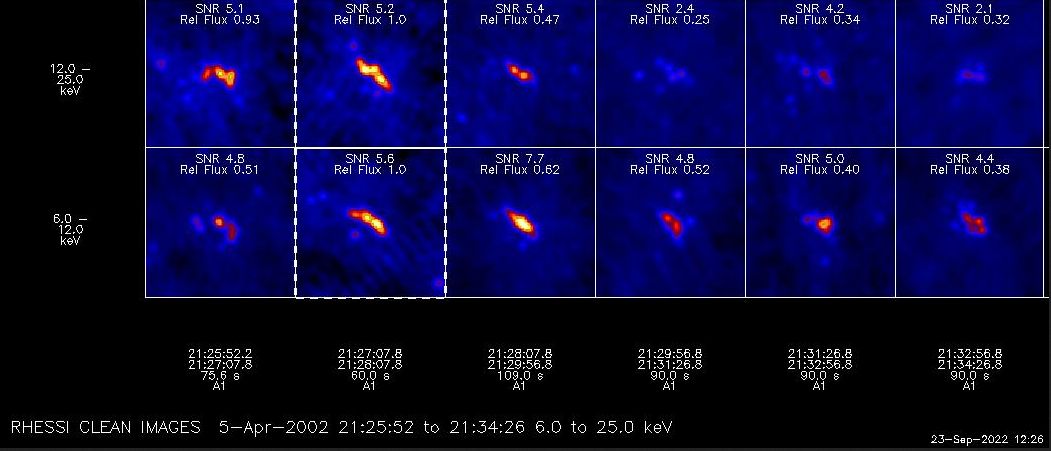
- RHESSI Image Archive - Science-ready images and related products for >75,000 RHESSI flares (all identified flares that had sufficient counts, and whose position could be determined) using six image reconstruction methods. Please see the RHESSI Image Archive Strategy for information on how the parameters for imaging, including the time and energy bins, were chosen. Please see the Guide to RHESSI Image Archive for an explanation of how to access the archive, and a detailed description of each type of plot shown in the archive.
- SDO/AIA cutout movies - Movies of AIA images of RHESSI flare locations in 10 wavelengths
Ancillary Data
- Roll Database - Verified roll angle database for the full mission. Used internally in RHESSI software.
- Calibration Database - Spectrometer calibration database, including gain/offset, spectral resolution, and low-energy threshold ("slow threshold") for triggers. Used internally in RHESSI software. Post-mission recalibration documentation here:
- Detector Health - Snapshot of the status of the front and rear segments of the nine RHESSI detectors at a resolution of one day. Criteria include detector off, voltage change, noisy data, unsegmented, and missing data. Stored both in computer-readable CSV files and monthly plot files showing green/amber/red indicating good/some problems/do not use for each day for each of the 18 detector segments. (more info on the status criteria, and the software that reads the health database)
- SAS Limb and Image Data - Orbital FITS files containing the Solar Aspect System (SAS) limb data and daily FITS files containing the SAS image data for the full RHESSI mission.
- Terrestrial Gamma-ray Flash (TGF) Database - In progress.
- Gamma-ray Burst Database - In progress.
- GOES Data - GOES (Geostationary Operational Environmental Satellites) data from multiple generations of satellites covering from 1976 to the present. Each GOES satellite carries an X-Ray Sensor (XRS) consisting of two ionization chambers to measure the total solar flux in two wavelength bands, 0.5 - 4 and 1 - 8 Angstroms. Since 2006, the GOES satellites have also carried an Extreme Ultraviolet Sensor (EUVS) which measures the EUV in 5 bands from ~5-127 nm. Earlier data are archived here, and more recent data are archived at the NOAA GOES-R website. The GOES Workbench software in SSWIDL provides an easy way to access and analyze the GOES XRS and EUV lightcurve data.
- Fermi GBM/LAT Solar Flare Observations - Quicklook products, data archives, and analysis software covering the solar X-ray and gamma-ray observations of both the Gamma-ray Burst Monitor (GBM) and Large Area Telescope (LAT).
- MESSENGER XRS Solar Observations - Data archive for the MESSENGER (MErcury Surface, Space ENvironment, GEochemistry, and Ranging) SAX (Solar Assembly for X-rays) instrument, 2004-2014, 1-10 keV, energy resolution of 598 eV at 5.9 keV, and nominal time cadence of 5 minutes. Data and analysis tools are described here.
- SOXS Observations - Data archive of SOXS (Solar X-ray Spectrometer) mission, Si-PIN, and CZT observations. SOXS was flown on the Indian GSAT-2 mission and was operational from 1-Jan-2004 to 2-May-2011. Data analysis tools are described here.
- SMM HXRBS Observations - Data archive of SMM (Solar Maximum Mission) HXRBS (Hard X-Ray Burst Spectrometer) observations. SMM was in operation from February 1980 to December 1989. The files and data analysis tools are described here.
- SMM GRS Observations - Data archive of SMM (Solar Maximum Mission) GRS (Gamma-Ray Spectrometer) observations. SMM was in operation from February 1980 to December 1989. The files and data analysis tools are described here.
- SOHO, STEREO, TRACE, Hinode, SDO, and more - The SHOW_SYNOP SSWIDL program provides access to GOES, SOHO, STEREO, TRACE, Hinode, SDO, radio, and other data sets. (more info)
- Cross-Mission Synoptic - Database and plots of solar flares jointly observed by GOES, RHESSI, Hinode, SDO, and IRIS (more info)
- JPEG2000 Images in Helioviewer - For every flare in the RHESSI Image Archive, JPEG2000 images were made for every time/energy bin and every image reconstruction algorithm. These are now available in helioviewer. The best way to view successive RHESSI images for a given energy/algorithm in helioviewer is to enable the Image Timeline, expand it so that every RHESSI image shows as a separate symbol, and double click on the image desired. Enabling the Features and Events/RHESSI/Flare checkbox puts a pin on the RHESSI image showing the flare number. Clicking the pin shows more information, including a link to the RHESSI Image Archive page for that flare.
Please include the following acknowledgement if you use these data in a paper or presentation:
"We acknowledge the use of the RHESSI Mission Archive available at https://hesperia.gsfc.nasa.gov/rhessi/mission-archive."